


Industrial properties in Farum
Companyspace.com today:
New today 87
Updated 24h 202
Notifications about new companyspaces1,932
Berlin +8
Vienna +4
Paris +2
Dublin (county) +2
Latest update 1 h ago
Active ads 372,731
12 industrial properties found
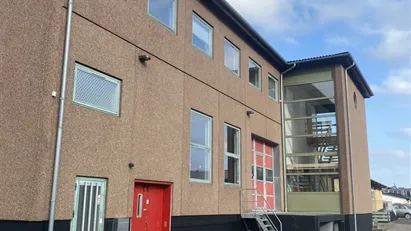
Industrial property in Farum, North Zealand
 More info
Industrial property in Farum, North Zealand
Industrial property for rent in Farum, North Zealand
Areal
Ca. 1,100 m2
Pris pr. md.
Ca. 55,000 DKK pr md
Område
Farum, North Zealand
Type
Industrial property
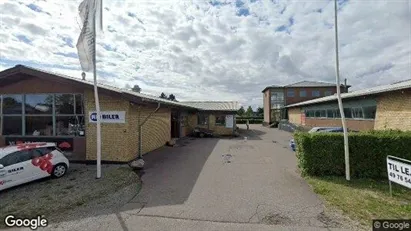
Industrial property in Farum, North Zealand
 More info
Industrial property in Farum, North Zealand
Industrial property for rent in Farum, North Zealand
Areal
Ca. 350 m2
Pris pr. md.
Ca. 21,900 DKK pr md
Område
Farum, North Zealand
Type
Industrial property
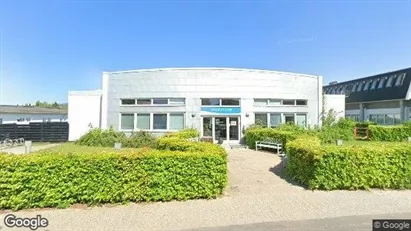
Warehouse in Farum, North Zealand
 More info
Warehouse in Farum, North Zealand
Warehouse for rent in Farum, North Zealand
Areal
Ca. 6,700 m2
Pris pr. md.
Ca. 377,250 DKK pr md
Område
Farum, North Zealand
Type
Warehouse
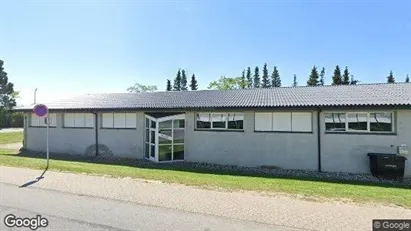
Industrial property in Farum, North Zealand
 More info
Industrial property in Farum, North Zealand
Industrial property for rent in Farum, North Zealand
Areal
Ca. 1,100 m2
Pris pr. md.
Ca. 55,000 DKK pr md
Område
Farum, North Zealand
Type
Industrial property
Warehouse in Farum, North Zealand
More info
We monitor the market!
Warehouse in Farum, North Zealand
Warehouse for rent in Farum, North Zealand
Areal
Ca. 720 m2
Pris pr. md.
Ca. 42,000 DKK pr md
Område
Farum, North Zealand
Type
Warehouse
Warehouse in Farum, North Zealand
More info
We monitor the market!
Warehouse in Farum, North Zealand
Warehouse for rent in Farum, North Zealand
Areal
Ca. 720 m2
Pris pr. md.
Ca. 42,000 DKK pr md
Område
Farum, North Zealand
Type
Warehouse
Warehouse in Farum, North Zealand
More info
We monitor the market!
Warehouse in Farum, North Zealand
Warehouse for rent in Farum, North Zealand
Areal
Ca. 980 m2
Pris pr. md.
Ca. 57,150 DKK pr md
Område
Farum, North Zealand
Type
Warehouse
Warehouse in Farum, North Zealand
More info
We monitor the market!
Warehouse in Farum, North Zealand
Warehouse for rent in Farum, North Zealand
Areal
Ca. 1,080 m2
Pris pr. md.
Ca. 52,500 DKK pr md
Område
Farum, North Zealand
Type
Warehouse
Warehouse in Farum, North Zealand
More info
We monitor the market!
Warehouse in Farum, North Zealand
Warehouse for rent in Farum, North Zealand
Areal
Ca. 3,500 m2
Pris pr. md.
Ca. 193,650 DKK pr md
Område
Farum, North Zealand
Type
Warehouse
Warehouse in Farum, North Zealand
 More info
Warehouse in Farum, North Zealand
Warehouse for rent in Farum, North Zealand
Areal
Ca. 1,175 m2
Pris pr. md.
Not stated
Område
Farum, North Zealand
Type
Warehouse
Warehouse property in Farum, North Zealand
 More info
Warehouse property in Farum, North Zealand
Warehouse for sale in Farum, North Zealand
Areal
-
Pris
Not stated
Område
Farum, North Zealand
Type
Warehouse
Warehouse property in Farum, North Zealand
 More info
Warehouse property in Farum, North Zealand
Warehouse for sale in Farum, North Zealand
Areal
-
Pris
Not stated
Område
Farum, North Zealand
Type
Warehouse
Selected customers
30,000 customers use Companyspace.com
30,000 customers
285,000 companies in our database
2,400 rentals annually
Companyspace.com is used by thousands of landlords, property companies, commercial real estate agents, investors and business centres seeking greater visibility, more enquiries and lower vacancy rates.


