


Commercial properties in Nibe
Companyspace.com today:
New today 734
Updated 24h 1,316
Notifications about new companyspaces1,813
Copenhagen +2
Stockholm +1
Vienna +19
Paris +6
Madrid +13
Dublin (county) +54
Warsaw +4
Greater London +8
Latest update 22 min ago
Active ads 361,096
15 commercial properties found
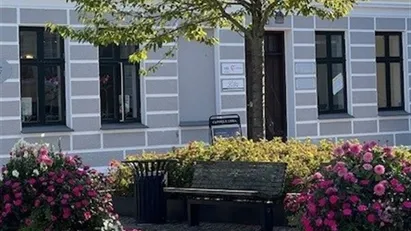
Commercial property in Nibe, Aalborg (region)
More info
We monitor the market!
Commercial property in Nibe, Aalborg (region)
Commercial property for sale in Nibe, Aalborg (region)
Areal
Ca. 1,020 m2
Pris
Not stated
Område
Nibe, Aalborg (region)
Type
Commercial property
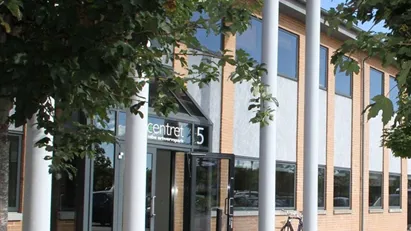
Office space in Nibe, Aalborg (region)
 More info
Office space in Nibe, Aalborg (region)
Office space for rent in Nibe, Aalborg (region)
Areal
Ca. 60 m2
Pris pr. md.
Ca. 5,500 DKK pr md
Område
Nibe, Aalborg (region)
Type
Office space
Office space in Nibe, Aalborg (region)
 More info
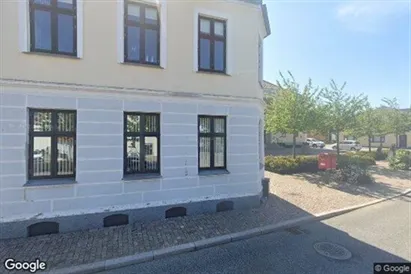
Office space in Nibe, Aalborg (region)
Office space for rent in Nibe, Aalborg (region)
Areal
Ca. 15 m2
Pris pr. md.
Ca. 2,500 DKK pr md
Område
Nibe, Aalborg (region)
Type
Office space
Warehouse in Nibe, Aalborg (region)
 More info
Warehouse in Nibe, Aalborg (region)
Warehouse for rent in Nibe, Aalborg (region)
Areal
Ca. 880 m2
Pris pr. md.
Ca. 30,900 DKK pr md
Område
Nibe, Aalborg (region)
Type
Warehouse
Office space in Nibe, Aalborg (region)
 More info
Office space in Nibe, Aalborg (region)
Office space for rent in Nibe, Aalborg (region)
Areal
Ca. 100 m2
Pris pr. md.
Ca. 7,000 DKK pr md
Område
Nibe, Aalborg (region)
Type
Office space
Office space in Nibe, Aalborg (region)
 More info
Office space in Nibe, Aalborg (region)
Office space for rent in Nibe, Aalborg (region)
Areal
Ca. 60 m2
Pris pr. md.
Ca. 5,500 DKK pr md
Område
Nibe, Aalborg (region)
Type
Office space
Shop in Nibe, Aalborg (region)
More info
We monitor the market!
Shop in Nibe, Aalborg (region)
Shop for rent in Nibe, Aalborg (region)
Areal
Ca. 100 m2
Pris pr. md.
Ca. 12,000 DKK pr md
Område
Nibe, Aalborg (region)
Type
Shop
Office space in Nibe, Aalborg (region)
 More info
Office space in Nibe, Aalborg (region)
Office space for rent in Nibe, Aalborg (region)
Areal
Ca. 100 m2
Pris pr. md.
Ca. 7,000 DKK pr md
Område
Nibe, Aalborg (region)
Type
Office space
Shop in Nibe, Aalborg (region)
More info
We monitor the market!
Shop in Nibe, Aalborg (region)
Shop for rent in Nibe, Aalborg (region)
Areal
Ca. 100 m2
Pris pr. md.
Ca. 12,000 DKK pr md
Område
Nibe, Aalborg (region)
Type
Shop
Warehouse in Nibe, Aalborg (region)
 More info
Warehouse in Nibe, Aalborg (region)
Warehouse for rent in Nibe, Aalborg (region)
Areal
Ca. 60 m2
Pris pr. md.
Ca. 5,000 DKK pr md
Område
Nibe, Aalborg (region)
Type
Warehouse
Warehouse in Nibe, Aalborg (region)
 More info
Warehouse in Nibe, Aalborg (region)
Warehouse for rent in Nibe, Aalborg (region)
Areal
Ca. 60 m2
Pris pr. md.
Ca. 5,000 DKK pr md
Område
Nibe, Aalborg (region)
Type
Warehouse
Shop in Nibe, Aalborg (region)
More info
We monitor the market!
Shop in Nibe, Aalborg (region)
Shop for rent in Nibe, Aalborg (region)
Areal
Ca. 160 m2
Pris pr. md.
Ca. 9,900 DKK pr md
Område
Nibe, Aalborg (region)
Type
Shop
Warehouse in Nibe, Aalborg (region)
More info
We monitor the market!
Warehouse in Nibe, Aalborg (region)
Warehouse for rent in Nibe, Aalborg (region)
Areal
Ca. 1,400 m2
Pris pr. md.
Ca. 1,150 DKK pr md
Område
Nibe, Aalborg (region)
Type
Warehouse
Warehouse in Nibe, Aalborg (region)
More info
We monitor the market!
Warehouse in Nibe, Aalborg (region)
Warehouse for rent in Nibe, Aalborg (region)
Areal
Ca. 1,400 m2
Pris pr. md.
Ca. 1,150 DKK pr md
Område
Nibe, Aalborg (region)
Type
Warehouse
Office space in Nibe, Aalborg (region)
More info
We monitor the market!
Office space in Nibe, Aalborg (region)
Office space for rent in Nibe, Aalborg (region)
Areal
Ca. 15 m2
Pris pr. md.
Ca. 2,500 DKK pr md
Område
Nibe, Aalborg (region)
Type
Office space
Selected customers
30,000 customers use Companyspace.com
30,000 customers
285,000 companies in our database
2,400 rentals annually
Companyspace.com is used by thousands of landlords, property companies, commercial real estate agents, investors and business centres seeking greater visibility, more enquiries and lower vacancy rates.


