


Commercial propertiesin Esbjerg (region)
Companyspace.com today:
New today 142
Updated 24h 642
Notifications about new companyspaces20
Copenhagen +4
Stockholm +1
Dublin (county) +1
Warsaw +3
Latest update 7 min ago
Active ads 364,343
83 commercial properties found
Commercial space in Esbjerg, Esbjerg (region)
 More info
Commercial space in Esbjerg, Esbjerg (region)
Commercial space for rent in Esbjerg, Esbjerg (region)
Areal
-
Pris pr. md.
Ca. 400 DKK per month
Område
Esbjerg, Esbjerg (region)
Type
Commercial property
Commercial space in Esbjerg, Esbjerg (region)
 More info
Commercial space in Esbjerg, Esbjerg (region)
Commercial space for rent in Esbjerg, Esbjerg (region)
Areal
-
Pris pr. md.
Ca. 1,050 DKK per month
Område
Esbjerg, Esbjerg (region)
Type
Commercial property
Commercial space in Esbjerg, Esbjerg (region)
 More info
Commercial space in Esbjerg, Esbjerg (region)
Commercial space for rent in Esbjerg, Esbjerg (region)
Areal
-
Pris pr. md.
Ca. 400 DKK per month
Område
Esbjerg, Esbjerg (region)
Type
Commercial property
Commercial space in Esbjerg, Esbjerg (region)
 More info
Commercial space in Esbjerg, Esbjerg (region)
Commercial space for rent in Esbjerg, Esbjerg (region)
Areal
Ca. 55 m2
Pris pr. md.
Ca. 5,200 DKK per month
Område
Esbjerg, Esbjerg (region)
Type
Commercial property
Commercial space in Esbjerg, Esbjerg (region)
 More info
Commercial space in Esbjerg, Esbjerg (region)
Commercial space for rent in Esbjerg, Esbjerg (region)
Areal
Ca. 70 m2
Pris pr. md.
Ca. 1,000 DKK per month
Område
Esbjerg, Esbjerg (region)
Type
Commercial property
Commercial space in Esbjerg, Esbjerg (region)
 More info
Commercial space in Esbjerg, Esbjerg (region)
Commercial space for rent in Esbjerg, Esbjerg (region)
Areal
-
Pris pr. md.
Ca. 400 DKK per month
Område
Esbjerg, Esbjerg (region)
Type
Commercial property
Commercial space in Esbjerg, Esbjerg (region)
 More info
Commercial space in Esbjerg, Esbjerg (region)
Commercial space for rent in Esbjerg, Esbjerg (region)
Areal
-
Pris pr. md.
Ca. 400 DKK per month
Område
Esbjerg, Esbjerg (region)
Type
Commercial property
Commercial space in Esbjerg, Esbjerg (region)
 More info
Commercial space in Esbjerg, Esbjerg (region)
Commercial space for rent in Esbjerg, Esbjerg (region)
Areal
Ca. 100 m2
Pris pr. md.
Ca. 7,400 DKK per month
Område
Esbjerg, Esbjerg (region)
Type
Commercial property
Commercial space in Esbjerg, Esbjerg (region)
 More info
Commercial space in Esbjerg, Esbjerg (region)
Commercial space for rent in Esbjerg, Esbjerg (region)
Areal
-
Pris pr. md.
Ca. 400 DKK per month
Område
Esbjerg, Esbjerg (region)
Type
Commercial property
Commercial space in Esbjerg, Esbjerg (region)
 More info
Commercial space in Esbjerg, Esbjerg (region)
Commercial space for rent in Esbjerg, Esbjerg (region)
Areal
-
Pris pr. md.
Ca. 450 DKK per month
Område
Esbjerg, Esbjerg (region)
Type
Commercial property
Commercial space in Esbjerg, Esbjerg (region)
 More info
Commercial space in Esbjerg, Esbjerg (region)
Commercial space for rent in Esbjerg, Esbjerg (region)
Areal
Ca. 65 m2
Pris pr. md.
Ca. 6,900 DKK per month
Område
Esbjerg, Esbjerg (region)
Type
Commercial property
Commercial space in Esbjerg, Esbjerg (region)
 More info
Commercial space in Esbjerg, Esbjerg (region)
Commercial space for rent in Esbjerg, Esbjerg (region)
Areal
Ca. 75 m2
Pris pr. md.
Ca. 6,300 DKK per month
Område
Esbjerg, Esbjerg (region)
Type
Commercial property
Commercial space in Esbjerg, Esbjerg (region)
 More info
Commercial space in Esbjerg, Esbjerg (region)
Commercial space for rent in Esbjerg, Esbjerg (region)
Areal
Ca. 60 m2
Pris pr. md.
Ca. 6,300 DKK per month
Område
Esbjerg, Esbjerg (region)
Type
Commercial property
Commercial space in Esbjerg, Esbjerg (region)
 More info
Commercial space in Esbjerg, Esbjerg (region)
Commercial space for rent in Esbjerg, Esbjerg (region)
Areal
Ca. 110 m2
Pris pr. md.
Ca. 6,900 DKK per month
Område
Esbjerg, Esbjerg (region)
Type
Commercial property
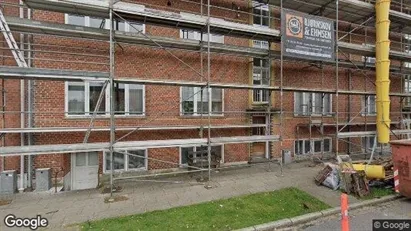
Commercial property in Esbjerg Ø, Esbjerg (region)
 More info
Commercial property in Esbjerg Ø, Esbjerg (region)
Commercial property for sale in Esbjerg Ø, Esbjerg (region)
Areal
Ca. 285 m2
Pris
Not stated
Område
Esbjerg Ø, Esbjerg (region)
Type
Commercial property
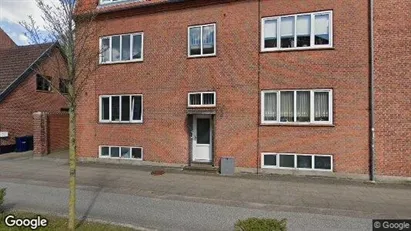
Commercial property in Esbjerg V, Esbjerg (region)
 More info
Commercial property in Esbjerg V, Esbjerg (region)
Commercial property for sale in Esbjerg V, Esbjerg (region)
Areal
Ca. 505 m2
Pris
Not stated
Område
Esbjerg V, Esbjerg (region)
Type
Commercial property
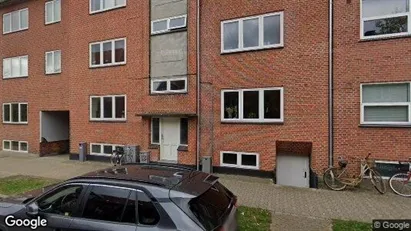
Commercial property in Esbjerg, Esbjerg (region)
 More info
Commercial property in Esbjerg, Esbjerg (region)
Commercial property for sale in Esbjerg, Esbjerg (region)
Areal
Ca. 745 m2
Pris
Not stated
Område
Esbjerg, Esbjerg (region)
Type
Commercial property
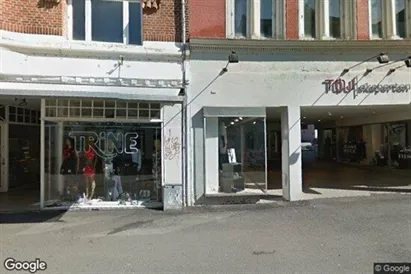
Commercial property in Esbjerg, Esbjerg (region)
 More info
Commercial property in Esbjerg, Esbjerg (region)
Commercial property for sale in Esbjerg, Esbjerg (region)
Areal
Ca. 315 m2
Pris
Not stated
Område
Esbjerg, Esbjerg (region)
Type
Commercial property
Selected customers
Selected customers
30,000 customers use Companyspace.com
30,000 customers
285,000 companies in our database
2,400 rentals annually
Companyspace.com is used by thousands of landlords, property companies, commercial real estate agents, investors and business centres seeking greater visibility, more enquiries and lower vacancy rates.


