


Commercial premises for rent in Europe
There are 281,960 available commercial properties in Europe right now. Companyspace.com collects commercial properties from many different parts of the market, so that you as a company can more easily get an overview of available commercial properties in Europe.
Companyspace.com today:
New today 515
Updated 24h 1,524
Notifications about new companyspaces1,785
Copenhagen +2
Amsterdam +12
Vienna +15
Paris +5
Dublin (county) +48
Warsaw +12
Greater London +6
Latest update 1 h ago
Active ads 369,103
281,960 company spaces found
Office space in Lansingerland, South Holland
 More info
Office space in Lansingerland, South Holland
Office space for rent in Lansingerland, South Holland
Areal
Ca. 30 m2
Pris pr. md.
Ca. 500 EUR pr md
Område
Lansingerland, South Holland
Type
Office space
Commercial space in Den Bosch, North Brabant
 More info
Commercial space in Den Bosch, North Brabant
Commercial space for rent in Den Bosch, North Brabant
Areal
Ca. 80 m2
Pris pr. md.
Ca. 1,650 EUR pr md
Område
Den Bosch, North Brabant
Type
Commercial property
Commercial space in Purmerend, North Holland
 More info
Commercial space in Purmerend, North Holland
Commercial space for rent in Purmerend, North Holland
Areal
Ca. 100 m2
Pris pr. md.
Ca. 1,100 EUR pr md
Område
Purmerend, North Holland
Type
Commercial property
Commercial space in Amsterdam Westpoort, Amsterdam
 More info
Commercial space in Amsterdam Westpoort, Amsterdam
Commercial space for rent in Amsterdam Westpoort, Amsterdam
Areal
Ca. 205 m2
Pris pr. md.
Ca. 2,750 EUR pr md
Område
Amsterdam Westpoort, Amsterdam
Type
Commercial property
Commercial space in Den Bosch, North Brabant
 More info
Commercial space in Den Bosch, North Brabant
Commercial space for rent in Den Bosch, North Brabant
Areal
Ca. 230 m2
Pris pr. md.
Ca. 1,650 EUR pr md
Område
Den Bosch, North Brabant
Type
Commercial property
Commercial space in Amsterdam Westpoort, Amsterdam
 More info
Commercial space in Amsterdam Westpoort, Amsterdam
Commercial space for rent in Amsterdam Westpoort, Amsterdam
Areal
Ca. 105 m2
Pris pr. md.
Ca. 2,000 EUR pr md
Område
Amsterdam Westpoort, Amsterdam
Type
Commercial property
Office space in Stichtse Vecht, Province of Utrecht
 More info
Office space in Stichtse Vecht, Province of Utrecht
Office space for rent in Stichtse Vecht, Province of Utrecht
Areal
Ca. 2,585 m2
Pris pr. md.
Not stated
Område
Stichtse Vecht, Province of Utrecht
Type
Office space
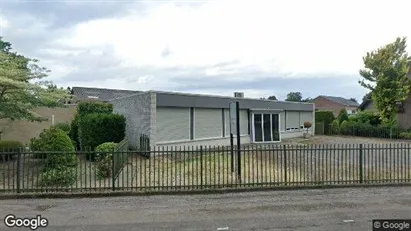
Office space in Bernheze, North Brabant
 More info
Office space in Bernheze, North Brabant
Office space for rent in Bernheze, North Brabant
Areal
Ca. 305 m2
Pris pr. md.
Ca. 200 EUR pr md
Område
Bernheze, North Brabant
Type
Office space
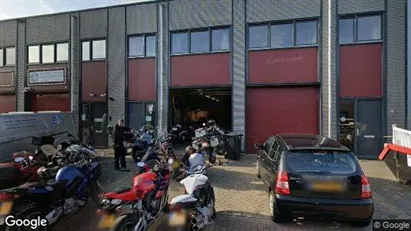
Commercial space in Bodegraven-Reeuwijk, South Holland
 More info
Commercial space in Bodegraven-Reeuwijk, South Holland
Commercial space for rent in Bodegraven-Reeuwijk, South Holland
Areal
Ca. 150 m2
Pris pr. md.
Ca. 1,350 EUR pr md
Område
Bodegraven-Reeuwijk, South Holland
Type
Commercial property
Office space in Brielle, South Holland
 More info
Office space in Brielle, South Holland
Office space for rent in Brielle, South Holland
Areal
Ca. 50 m2
Pris pr. md.
Ca. 750 EUR pr md
Område
Brielle, South Holland
Type
Office space
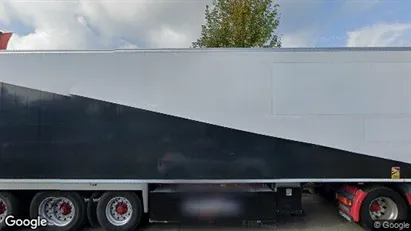
Commercial space in Boxtel, North Brabant
 More info
Commercial space in Boxtel, North Brabant
Commercial space for rent in Boxtel, North Brabant
Areal
Ca. 125 m2
Pris pr. md.
Ca. 1,400 EUR pr md
Område
Boxtel, North Brabant
Type
Commercial property
Commercial space in Rucphen, North Brabant
 More info
Commercial space in Rucphen, North Brabant
Commercial space for rent in Rucphen, North Brabant
Areal
Ca. 65 m2
Pris pr. md.
Ca. 850 EUR pr md
Område
Rucphen, North Brabant
Type
Commercial property
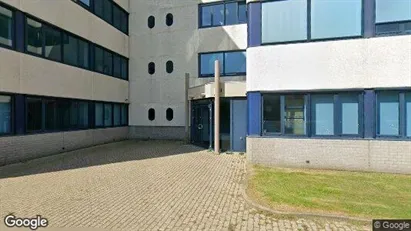
Office space in Veenendaal, Province of Utrecht
 More info
Office space in Veenendaal, Province of Utrecht
Kantoor te huur in Veenendaal, Utrecht-provincie
Areal
Ca. 25 m2
Pris pr. md.
Ca. 450 EUR pr md
Område
Veenendaal, Province of Utrecht
Type
Office space
Office space in Bergen op Zoom, North Brabant
 More info
Office space in Bergen op Zoom, North Brabant
Office space for rent in Bergen op Zoom, North Brabant
Areal
Ca. 350 m2
Pris pr. md.
Ca. 3,750 EUR pr md
Område
Bergen op Zoom, North Brabant
Type
Office space
Commercial space in Amersfoort, Province of Utrecht
 More info
Commercial space in Amersfoort, Province of Utrecht
Commercial space for rent in Amersfoort, Province of Utrecht
Areal
Ca. 130 m2
Pris pr. md.
Ca. 1,450 EUR pr md
Område
Amersfoort, Province of Utrecht
Type
Commercial property
Commercial space in Den Helder, North Holland
 More info
Commercial space in Den Helder, North Holland
Commercial space for rent in Den Helder, North Holland
Areal
Ca. 2,035 m2
Pris pr. md.
Not stated
Område
Den Helder, North Holland
Type
Commercial property
Office space in Arnhem, Gelderland
 More info
Office space in Arnhem, Gelderland
Kantoor te huur in Arnhem, Gelderland
Areal
20 - 45 m2
Pris pr. md.
Ca. 450 EUR pr md
Område
Arnhem, Gelderland
Type
Office space
Office space in Rheden, Gelderland
 More info
Office space in Rheden, Gelderland
Kantoor te huur in Rheden, Gelderland
Areal
Ca. 45 m2
Pris pr. md.
Ca. 750 EUR pr md
Område
Rheden, Gelderland
Type
Office space
Selected customers
30,000 customers use Companyspace.com
30,000 customers
285,000 companies in our database
2,400 rentals annually
Companyspace.com is used by thousands of landlords, property companies, commercial real estate agents, investors and business centres seeking greater visibility, more enquiries and lower vacancy rates.


