


Commercial premises for rent in Europe
There are 283,771 available commercial properties in Europe right now. Companyspace.com collects commercial properties from many different parts of the market, so that you as a company can more easily get an overview of available commercial properties in Europe.
Companyspace.com today:
New today 2,889
Updated 24h 3,962
Notifications about new companyspaces1,639
Amsterdam +3
Berlin +3
Vienna +6
Paris +5
Madrid +4
Dublin (county) +23
Warsaw +19
Greater London +12
Latest update 37 min ago
Active ads 368,911
283,771 company spaces found
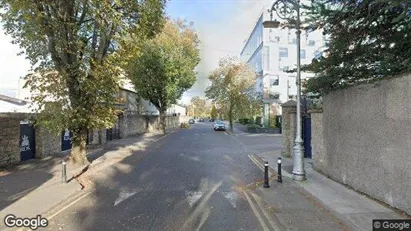
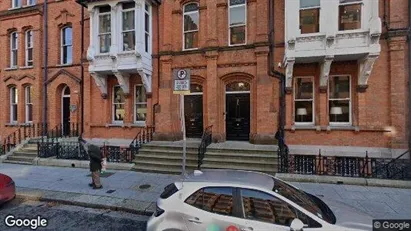
Office space in Dublin 6, Dublin
 More info
Office space in Dublin 6, Dublin
Office space for rent in Dublin 6, Dublin
Areal
Ca. 95 m2
Pris pr. md.
Ca. 1,100 EUR pr md
Område
Dublin 6, Dublin
Type
Office space
Office space in Blackrock, Dublin (county)
 More info
Office space in Blackrock, Dublin (county)
Office space for rent in Blackrock, Dublin (county)
Areal
Ca. 15 m2
Pris pr. md.
Ca. 900 EUR pr md
Område
Blackrock, Dublin (county)
Type
Office space
Warehouse in Hadsten, Central Jutland Region
 More info
Warehouse in Hadsten, Central Jutland Region
Warehouse for rent in Hadsten, Central Jutland Region
Areal
Ca. 485 m2
Pris pr. md.
Ca. 15,000 DKK pr md
Område
Hadsten, Central Jutland Region
Type
Warehouse
Office space in Dublin 18, Dublin
 More info
Office space in Dublin 18, Dublin
Office space for rent in Dublin 18, Dublin
Areal
-
Pris pr. md.
Ca. 1,200 EUR pr md
Område
Dublin 18, Dublin
Type
Office space
Office space in Dublin 2, Dublin
 More info
Office space in Dublin 2, Dublin
Office space for rent in Dublin 2, Dublin
Areal
Ca. 15 m2
Pris pr. md.
Ca. 1,500 EUR pr md
Område
Dublin 2, Dublin
Type
Office space
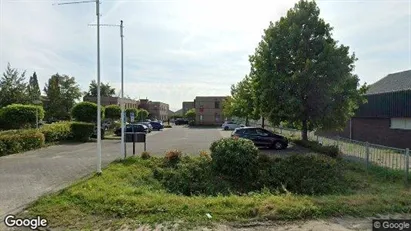
Commercial space in Soest, Province of Utrecht
 More info
Commercial space in Soest, Province of Utrecht
Commercial space for rent in Soest, Province of Utrecht
Areal
Ca. 1,160 m2
Pris pr. md.
Ca. 5,000 EUR pr md
Område
Soest, Province of Utrecht
Type
Commercial property
Office space in Dublin 24, Dublin
 More info
Office space in Dublin 24, Dublin
Office space for rent in Dublin 24, Dublin
Areal
Ca. 185 m2
Pris pr. md.
Ca. 6,000 EUR pr md
Område
Dublin 24, Dublin
Type
Office space
Office space in Haarlemmermeer, North Holland
 More info
Office space in Haarlemmermeer, North Holland
Office space for rent in Haarlemmermeer, North Holland
Areal
Ca. 105 m2
Pris pr. md.
Not stated
Område
Haarlemmermeer, North Holland
Type
Office space
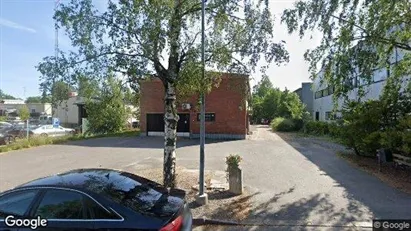
Office space in Hollola, Päijät-Häme
 More info
Office space in Hollola, Päijät-Häme
Office space for rent in Hollola, Päijät-Häme
Areal
-
Pris pr. md.
Ca. 28,000 EUR pr md
Område
Hollola, Päijät-Häme
Type
Office space
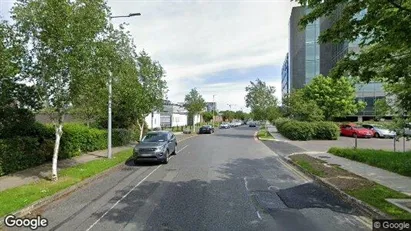
Office space in Dublin 4, Dublin
 More info
Office space in Dublin 4, Dublin
Office space for rent in Dublin 4, Dublin
Areal
Ca. 630 m2
Pris pr. md.
Ca. 30,000 EUR pr md
Område
Dublin 4, Dublin
Type
Office space
Industrial property in Hollola, Päijät-Häme
 More info
Industrial property in Hollola, Päijät-Häme
Industrial property for rent in Hollola, Päijät-Häme
Areal
-
Pris pr. md.
Ca. 132,000 EUR pr md
Område
Hollola, Päijät-Häme
Type
Industrial property
Office space in Antwerp Deurne, Antwerp
 More info
Office space in Antwerp Deurne, Antwerp
Office space for rent in Antwerp Deurne, Antwerp
Areal
Ca. 165 m2
Pris pr. md.
Ca. 1,250 EUR pr md
Område
Antwerp Deurne, Antwerp
Type
Office space
Industrial property in Hollola, Päijät-Häme
 More info
Industrial property in Hollola, Päijät-Häme
Industrial property for rent in Hollola, Päijät-Häme
Areal
-
Pris pr. md.
Ca. 160,000 EUR pr md
Område
Hollola, Päijät-Häme
Type
Industrial property
Office space in Helsinki Pohjoinen, Helsinki
 More info
Office space in Helsinki Pohjoinen, Helsinki
Office space for rent in Helsinki Pohjoinen, Helsinki
Areal
Ca. 295 m2
Pris pr. md.
Not stated
Område
Helsinki Pohjoinen, Helsinki
Type
Office space
Office space in Dublin 2, Dublin
 More info
Office space in Dublin 2, Dublin
Office space for rent in Dublin 2, Dublin
Areal
Ca. 25 m2
Pris pr. md.
Ca. 3,150 EUR pr md
Område
Dublin 2, Dublin
Type
Office space
Commercial space in Den Helder, North Holland
 More info
Commercial space in Den Helder, North Holland
Commercial space for rent in Den Helder, North Holland
Areal
Ca. 1,250 m2
Pris pr. md.
Ca. 100 EUR pr md
Område
Den Helder, North Holland
Type
Commercial property
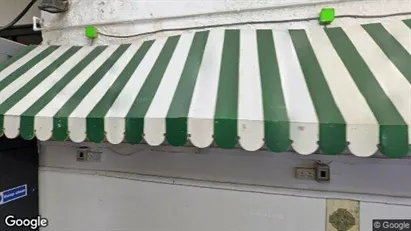
Office space in Dublin 2, Dublin
 More info
Office space in Dublin 2, Dublin
Office space for rent in Dublin 2, Dublin
Areal
Ca. 10 m2
Pris pr. md.
Ca. 750 EUR pr md
Område
Dublin 2, Dublin
Type
Office space
Office space in Haarlemmermeer, North Holland
 More info
Office space in Haarlemmermeer, North Holland
Office space for rent in Haarlemmermeer, North Holland
Areal
Ca. 75 m2
Pris pr. md.
Ca. 1,650 EUR pr md
Område
Haarlemmermeer, North Holland
Type
Office space
Selected customers
30,000 customers use Companyspace.com
30,000 customers
285,000 companies in our database
2,400 rentals annually
Companyspace.com is used by thousands of landlords, property companies, commercial real estate agents, investors and business centres seeking greater visibility, more enquiries and lower vacancy rates.


