


Commercial premises for rent in Europe
There are 282,004 available commercial properties in Europe right now. Companyspace.com collects commercial properties from many different parts of the market, so that you as a company can more easily get an overview of available commercial properties in Europe.
Companyspace.com today:
New today 482
Updated 24h 1,491
Notifications about new companyspaces1,631
Copenhagen +2
Amsterdam +12
Vienna +1
Paris +5
Dublin (county) +48
Warsaw +12
Greater London +6
Latest update 37 min ago
Active ads 369,046
282,004 company spaces found
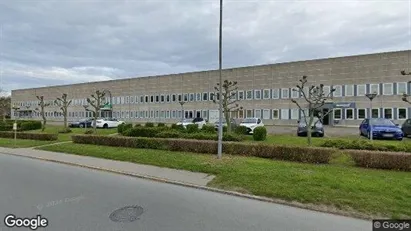
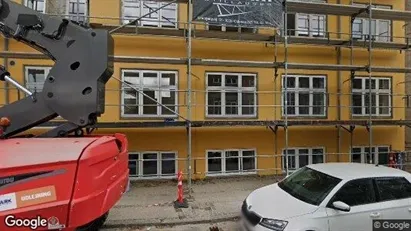
Office space in Aalborg, Aalborg (region)
 More info
Office space in Aalborg, Aalborg (region)
Office space for rent in Aalborg, Aalborg (region)
Areal
Ca. 665 m2
Pris pr. md.
Ca. 60,850 DKK pr md
Område
Aalborg, Aalborg (region)
Type
Office space
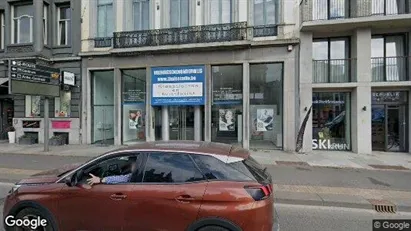
Commercial space in Vesterbro, Copenhagen
 More info
Commercial space in Vesterbro, Copenhagen
Commercial space for rent in Vesterbro, Copenhagen
Areal
-
Pris pr. md.
Not stated
Område
Vesterbro, Copenhagen
Type
Commercial property
Office space in Viborg, Central Jutland Region
 More info
Office space in Viborg, Central Jutland Region
Office space for rent in Viborg, Central Jutland Region
Areal
Ca. 295 m2
Pris pr. md.
Ca. 26,100 DKK pr md
Område
Viborg, Central Jutland Region
Type
Office space
Office space in Taastrup, Greater Copenhagen
 More info
Office space in Taastrup, Greater Copenhagen
Office space for rent in Taastrup, Greater Copenhagen
Areal
Ca. 880 m2
Pris pr. md.
Ca. 36,750 DKK pr md
Område
Taastrup, Greater Copenhagen
Type
Office space
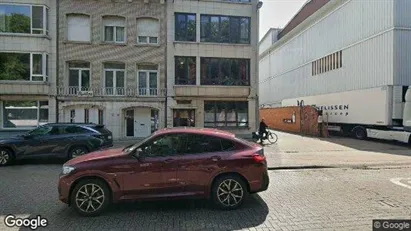
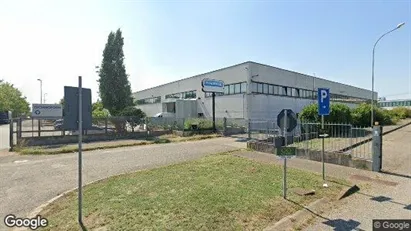
Office space in Stad Antwerp, Antwerp
 More info
Office space in Stad Antwerp, Antwerp
Office space for rent in Stad Antwerp, Antwerp
Areal
220 - 650 m2
Pris pr. md.
Ca. 7,300 EUR pr md
Område
Stad Antwerp, Antwerp
Type
Office space
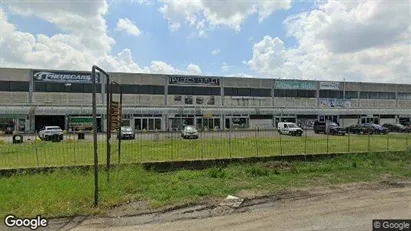
Commercial space in Cusago, Lombardia
 More info
Commercial space in Cusago, Lombardia
Commercial space for rent in Cusago, Lombardia
Areal
Ca. 1,250 m2
Pris pr. md.
Ca. 12,500 EUR pr md
Område
Cusago, Lombardia
Type
Commercial property
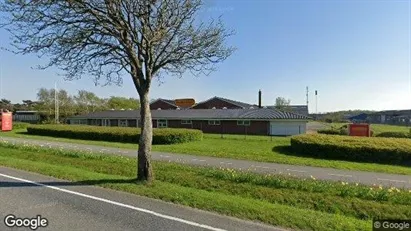
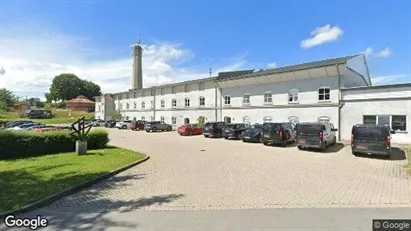
Office space in Bramming, Region of Southern Denmark
 More info
Office space in Bramming, Region of Southern Denmark
Office space for rent in Bramming, Region of Southern Denmark
Areal
Ca. 750 m2
Pris pr. md.
Ca. 23,450 DKK pr md
Område
Bramming, Region of Southern Denmark
Type
Office space
Office space in Aarhus C, Aarhus
More info
Office space in Aarhus C, Aarhus
Office space for rent in Aarhus C, Aarhus
Areal
Ca. 445 m2
Pris pr. md.
Ca. 1,600 DKK pr md
Område
Aarhus C, Aarhus
Type
Office space
Office space in Odense C, Odense
 More info
Office space in Odense C, Odense
Office space for rent in Odense C, Odense
Areal
Ca. 250 m2
Pris pr. md.
Ca. 21,800 DKK pr md
Område
Odense C, Odense
Type
Office space
Commercial space in Liscate, Lombardia
 More info
Commercial space in Liscate, Lombardia
Commercial space for rent in Liscate, Lombardia
Areal
Ca. 1,120 m2
Pris pr. md.
Ca. 6,400 EUR pr md
Område
Liscate, Lombardia
Type
Commercial property
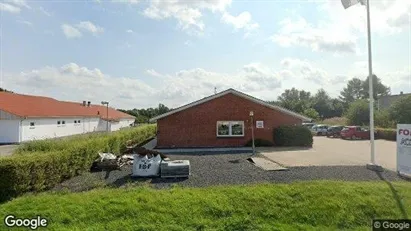
Commercial space in Esbjerg, Esbjerg (region)
 More info
Commercial space in Esbjerg, Esbjerg (region)
Commercial space for rent in Esbjerg, Esbjerg (region)
Areal
Ca. 80 m2
Pris pr. md.
Ca. 6,700 DKK pr md
Område
Esbjerg, Esbjerg (region)
Type
Commercial property
Office space in Stad Antwerp, Antwerp
 More info
Office space in Stad Antwerp, Antwerp
Office space for rent in Stad Antwerp, Antwerp
Areal
Ca. 685 m2
Pris pr. md.
Ca. 8,600 EUR pr md
Område
Stad Antwerp, Antwerp
Type
Office space
Office space in Aalborg SØ, Aalborg (region)
 More info
Office space in Aalborg SØ, Aalborg (region)
Office space for rent in Aalborg SØ, Aalborg (region)
Areal
Ca. 460 m2
Pris pr. md.
Ca. 24,900 DKK pr md
Område
Aalborg SØ, Aalborg (region)
Type
Office space
Office space in Hillerød, North Zealand
 More info
Office space in Hillerød, North Zealand
Office space for rent in Hillerød, North Zealand
Areal
Ca. 220 m2
Pris pr. md.
Ca. 15,450 DKK pr md
Område
Hillerød, North Zealand
Type
Office space
Commercial space in Cusago, Lombardia
 More info
Commercial space in Cusago, Lombardia
Commercial space for rent in Cusago, Lombardia
Areal
Ca. 2,350 m2
Pris pr. md.
Ca. 16,800 EUR pr md
Område
Cusago, Lombardia
Type
Commercial property
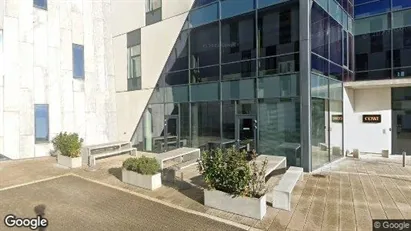
Office space in Copenhagen K, Copenhagen
More info
Office space in Copenhagen K, Copenhagen
Office space for rent in Copenhagen K, Copenhagen
Areal
-
Pris pr. md.
Not stated
Område
Copenhagen K, Copenhagen
Type
Office space
Office space in Sønderborg, Region of Southern Denmark
 More info
Office space in Sønderborg, Region of Southern Denmark
Office space for rent in Sønderborg, Region of Southern Denmark
Areal
Ca. 865 m2
Pris pr. md.
Ca. 50,500 DKK pr md
Område
Sønderborg, Region of Southern Denmark
Type
Office space
Commercial space in Falun, Dalarna
More info
Commercial space in Falun, Dalarna
Commercial space for rent in Falun, Dalarna
Areal
-
Pris pr. md.
Ca. 100 SEK pr md
Område
Falun, Dalarna
Type
Commercial property
Selected customers
30,000 customers use Companyspace.com
30,000 customers
285,000 companies in our database
2,400 rentals annually
Companyspace.com is used by thousands of landlords, property companies, commercial real estate agents, investors and business centres seeking greater visibility, more enquiries and lower vacancy rates.


