


Commercial premises for rent in Europe
There are 283,773 available commercial properties in Europe right now. Companyspace.com collects commercial properties from many different parts of the market, so that you as a company can more easily get an overview of available commercial properties in Europe.
Companyspace.com today:
New today 2,864
Updated 24h 4,038
Notifications about new companyspaces1,228
Berlin +3
Paris +5
Madrid +4
Dublin (county) +23
Warsaw +19
Greater London +12
Latest update 41 min ago
Active ads 368,922
283,773 company spaces found
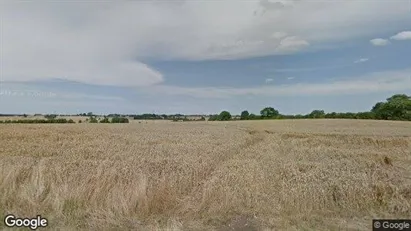
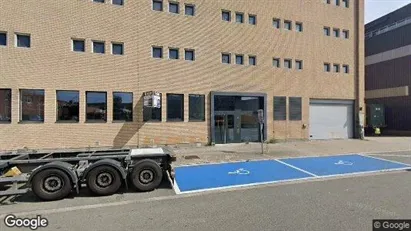
Warehouse in Skals, Central Jutland Region
 More info
Warehouse in Skals, Central Jutland Region
Warehouse for rent in Skals, Central Jutland Region
Areal
Ca. 14,880 m2
Pris pr. md.
Ca. 217,000 DKK pr md
Område
Skals, Central Jutland Region
Type
Warehouse
Warehouse in Vejle, Vejle (region)
 More info
Warehouse in Vejle, Vejle (region)
Warehouse for rent in Vejle, Vejle (region)
Areal
Ca. 10,000 m2
Pris pr. md.
Ca. 416,650 DKK pr md
Område
Vejle, Vejle (region)
Type
Warehouse
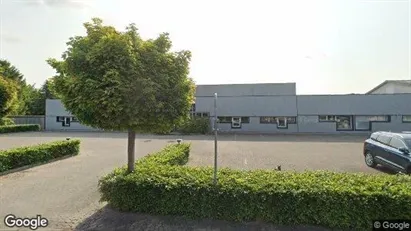
Office space in Aarhus C, Aarhus
 More info
Office space in Aarhus C, Aarhus
Office space for rent in Aarhus C, Aarhus
Areal
Ca. 915 m2
Pris pr. md.
Ca. 83,950 DKK pr md
Område
Aarhus C, Aarhus
Type
Office space
Office space in Copenhagen S, Copenhagen
 More info
Office space in Copenhagen S, Copenhagen
Office space for rent in Copenhagen S, Copenhagen
Areal
Ca. 1,130 m2
Pris pr. md.
Ca. 141,000 DKK pr md
Område
Copenhagen S, Copenhagen
Type
Office space
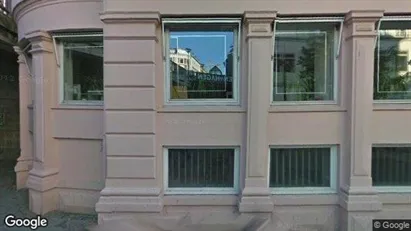
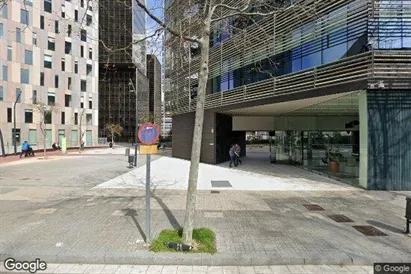
Commercial space in Helsinki Keskinen, Helsinki
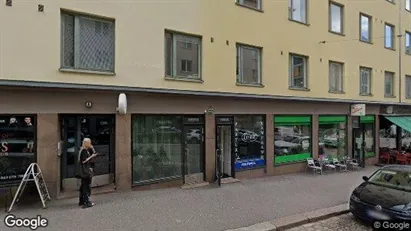 More info
Commercial space in Helsinki Keskinen, Helsinki
Commercial space Vuokrattavana sisälläHelsinki Keskinen, Helsinki
Areal
Ca. 55 m2
Pris pr. md.
Ca. 10,400 EUR pr md
Område
Helsinki Keskinen, Helsinki
Type
Commercial property
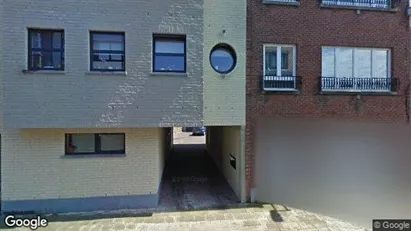
Land in Stichtse Vecht, Province of Utrecht
 More info
Land in Stichtse Vecht, Province of Utrecht
Land for rent in Stichtse Vecht, Province of Utrecht
Areal
Ca. 140 m2
Pris pr. md.
Ca. 1,800 EUR pr md
Område
Stichtse Vecht, Province of Utrecht
Type
Land
Commercial space in Turnhout, Antwerp (Province)
 More info
Commercial space in Turnhout, Antwerp (Province)
Commercial space for rent in Turnhout, Antwerp (Province)
Areal
Ca. 50 m2
Pris pr. md.
Ca. 800 EUR pr md
Område
Turnhout, Antwerp (Province)
Type
Commercial property
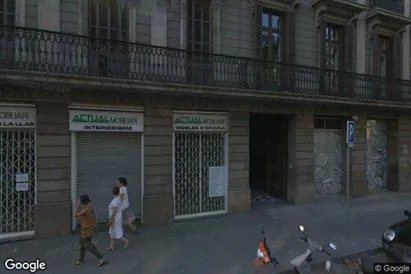
Commercial space in Barcelona Eixample, Barcelona
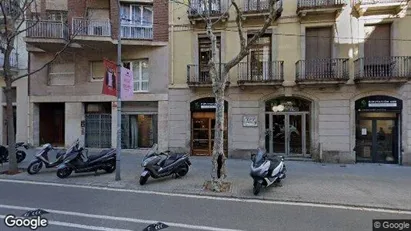 More info
Commercial space in Barcelona Eixample, Barcelona
Commercial space for rent in Barcelona Eixample, Barcelona
Areal
Ca. 5 m2
Pris pr. md.
Ca. 250 EUR pr md
Område
Barcelona Eixample, Barcelona
Type
Commercial property
Office space in Veldhoven, North Brabant
 More info
Office space in Veldhoven, North Brabant
Office space for rent in Veldhoven, North Brabant
Areal
Ca. 670 m2
Pris pr. md.
Not stated
Område
Veldhoven, North Brabant
Type
Office space
Office space in Ridderkerk, South Holland
 More info
Office space in Ridderkerk, South Holland
Office space for rent in Ridderkerk, South Holland
Areal
Ca. 40 m2
Pris pr. md.
Ca. 299,000 EUR pr md
Område
Ridderkerk, South Holland
Type
Office space
Office space in Stad Antwerp, Antwerp
 More info
Office space in Stad Antwerp, Antwerp
Office space for rent in Stad Antwerp, Antwerp
Areal
Ca. 600 m2
Pris pr. md.
Ca. 6,000 EUR pr md
Område
Stad Antwerp, Antwerp
Type
Office space
Commercial space in Barcelona Eixample, Barcelona
 More info
Commercial space in Barcelona Eixample, Barcelona
Commercial space for rent in Barcelona Eixample, Barcelona
Areal
Ca. 85 m2
Pris pr. md.
Ca. 150 EUR pr md
Område
Barcelona Eixample, Barcelona
Type
Commercial property
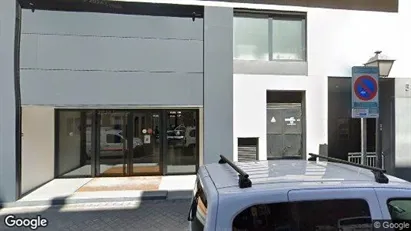
Office space in Madrid Salamanca, Madrid
 More info
Office space in Madrid Salamanca, Madrid
Office space for rent in Madrid Salamanca, Madrid
Areal
200 - 340 m2
Pris pr. md.
Ca. 8,500 EUR pr md
Område
Madrid Salamanca, Madrid
Type
Office space
Commercial space in Barcelona Sant Martí, Barcelona
 More info
Commercial space in Barcelona Sant Martí, Barcelona
Commercial space for rent in Barcelona Sant Martí, Barcelona
Areal
Ca. 20 m2
Pris pr. md.
Ca. 250 EUR pr md
Område
Barcelona Sant Martí, Barcelona
Type
Commercial property
Office space in Leipzig, Sachsen
 More info
Office space in Leipzig, Sachsen
Office space for rent in Leipzig, Sachsen
Areal
Ca. 725 m2
Pris pr. md.
Not stated
Område
Leipzig, Sachsen
Type
Office space
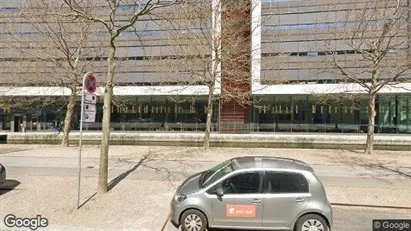
Office space in The Hague Laak, The Hague
 More info
Office space in The Hague Laak, The Hague
Kantoor te huur in Den Haag Laak, Den Haag
Areal
37 - 458 m2
Pris pr. md.
Ca. 1,300 EUR pr md
Område
The Hague Laak, The Hague
Type
Office space
Commercial space in Málaga, Andalucía
 More info
Commercial space in Málaga, Andalucía
Commercial space for rent in Málaga, Andalucía
Areal
Ca. 5 m2
Pris pr. md.
Ca. 350 EUR pr md
Område
Málaga, Andalucía
Type
Commercial property
Office space in Mechelen, Antwerp (Province)
 More info
Office space in Mechelen, Antwerp (Province)
Office space for rent in Mechelen, Antwerp (Province)
Areal
570 - 1,182 m2
Pris pr. md.
Ca. 15,500 EUR pr md
Område
Mechelen, Antwerp (Province)
Type
Office space
Selected customers
30,000 customers use Companyspace.com
30,000 customers
285,000 companies in our database
2,400 rentals annually
Companyspace.com is used by thousands of landlords, property companies, commercial real estate agents, investors and business centres seeking greater visibility, more enquiries and lower vacancy rates.


