


Commercial premises for rent in Europe
There are 284,056 available commercial properties in Europe right now. Companyspace.com collects commercial properties from many different parts of the market, so that you as a company can more easily get an overview of available commercial properties in Europe.
Companyspace.com today:
New today 2,911
Updated 24h 3,925
Notifications about new companyspaces2,086
Copenhagen +4
Stockholm +1
Amsterdam +3
Berlin +3
Vienna +6
Paris +5
Madrid +4
Dublin (county) +23
Warsaw +19
Greater London +13
Latest update 24 min ago
Active ads 369,195
284,056 company spaces found
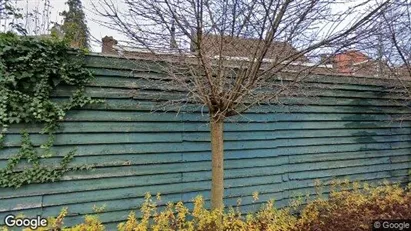
Commercial space in Amstelveen, North Holland
 More info
Commercial space in Amstelveen, North Holland
Commercial space for rent in Amstelveen, North Holland
Areal
Ca. 120 m2
Pris pr. md.
Ca. 1,800 EUR pr md
Område
Amstelveen, North Holland
Type
Commercial property
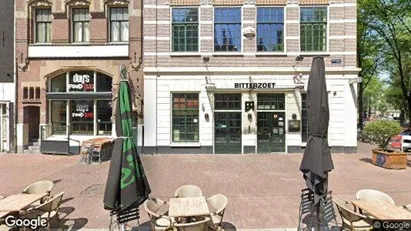
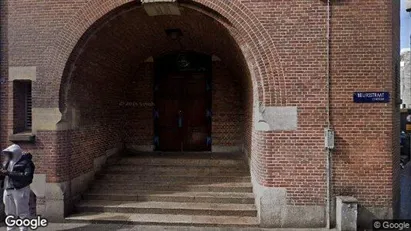
Office space in Amsterdam Centrum, Amsterdam
 More info
Office space in Amsterdam Centrum, Amsterdam
Office space for rent in Amsterdam Centrum, Amsterdam
Areal
Ca. 380 m2
Pris pr. md.
Ca. 6,450 EUR pr md
Område
Amsterdam Centrum, Amsterdam
Type
Office space
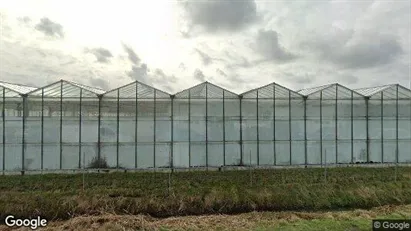
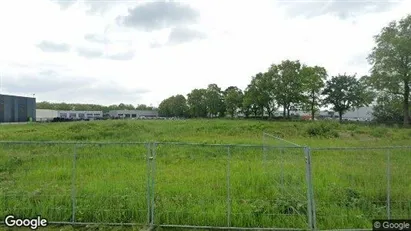
Industrial property in Hulst, Zeeland
 More info
Industrial property in Hulst, Zeeland
Industrial property for rent in Hulst, Zeeland
Areal
-
Pris pr. md.
Ca. 800 EUR pr md
Område
Hulst, Zeeland
Type
Industrial property
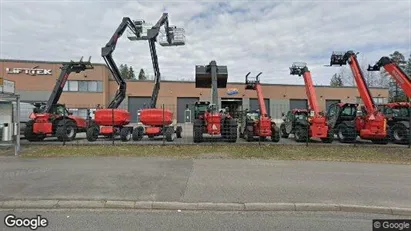
Office space in Vantaa, Uusimaa
 More info
Office space in Vantaa, Uusimaa
Office space for rent in Vantaa, Uusimaa
Areal
Ca. 1,800 m2
Pris pr. md.
Not stated
Område
Vantaa, Uusimaa
Type
Office space
Office space in Kalundborg, Region Zealand
 More info
Office space in Kalundborg, Region Zealand
Office space for rent in Kalundborg, Region Zealand
Areal
Ca. 680 m2
Pris pr. md.
Ca. 6,500 DKK pr md
Område
Kalundborg, Region Zealand
Type
Office space
Warehouse in Præstø, Region Zealand
More info
Warehouse in Præstø, Region Zealand
Warehouse for rent in Præstø, Region Zealand
Areal
Ca. 400 m2
Pris pr. md.
Ca. 12,500 DKK pr md
Område
Præstø, Region Zealand
Type
Warehouse
Office space in Copenhagen K, Copenhagen
More info
Office space in Copenhagen K, Copenhagen
Office space for rent in Copenhagen K, Copenhagen
Areal
Ca. 665 m2
Pris pr. md.
Ca. 116,550 DKK pr md
Område
Copenhagen K, Copenhagen
Type
Office space
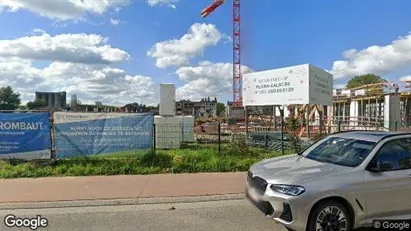
Commercial space in Aalst, Oost-Vlaanderen
 More info
Commercial space in Aalst, Oost-Vlaanderen
Commercial space for rent in Aalst, Oost-Vlaanderen
Areal
-
Pris pr. md.
Ca. 2,100 EUR pr md
Område
Aalst, Oost-Vlaanderen
Type
Commercial property
Office space in Kvistgård, North Zealand
More info
Office space in Kvistgård, North Zealand
Office space for rent in Kvistgård, North Zealand
Areal
Ca. 900 m2
Pris pr. md.
Ca. 65,300 DKK pr md
Område
Kvistgård, North Zealand
Type
Office space
Warehouse in Kalundborg, Region Zealand
More info
Warehouse in Kalundborg, Region Zealand
Warehouse for rent in Kalundborg, Region Zealand
Areal
Ca. 6,215 m2
Pris pr. md.
Ca. 181,300 DKK pr md
Område
Kalundborg, Region Zealand
Type
Warehouse
Office space in Copenhagen S, Copenhagen
More info
Office space in Copenhagen S, Copenhagen
Office space for rent in Copenhagen S, Copenhagen
Areal
-
Pris pr. md.
Not stated
Område
Copenhagen S, Copenhagen
Type
Office space
Commercial space in Roosendaal, North Brabant
 More info
Commercial space in Roosendaal, North Brabant
Commercial space for rent in Roosendaal, North Brabant
Areal
Ca. 180 m2
Pris pr. md.
Ca. 1,250 EUR pr md
Område
Roosendaal, North Brabant
Type
Commercial property
Office space in Amsterdam Centrum, Amsterdam
 More info
Office space in Amsterdam Centrum, Amsterdam
Office space for rent in Amsterdam Centrum, Amsterdam
Areal
Ca. 70 m2
Pris pr. md.
Ca. 1,450 EUR pr md
Område
Amsterdam Centrum, Amsterdam
Type
Office space
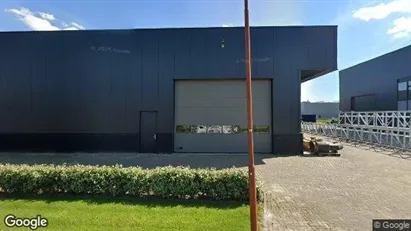
Commercial space in Boxmeer, North Brabant
 More info
Commercial space in Boxmeer, North Brabant
Commercial space for rent in Boxmeer, North Brabant
Areal
Ca. 905 m2
Pris pr. md.
Ca. 3,750 EUR pr md
Område
Boxmeer, North Brabant
Type
Commercial property
Commercial space in Amsterdam Oost-Watergraafsmeer, Amsterdam
 More info
Commercial space in Amsterdam Oost-Watergraafsmeer, Amsterdam
Commercial space for rent in Amsterdam Oost-Watergraafsmeer, Amsterdam
Areal
Ca. 140 m2
Pris pr. md.
Ca. 4,350 EUR pr md
Område
Amsterdam Oost-Watergraafsmeer, Amsterdam
Type
Commercial property
Commercial space in Rødovre, Greater Copenhagen
 More info
Commercial space in Rødovre, Greater Copenhagen
Commercial space for rent in Rødovre, Greater Copenhagen
Areal
Ca. 50 m2
Pris pr. md.
Ca. 9,600 DKK pr md
Område
Rødovre, Greater Copenhagen
Type
Commercial property
Office space in Amsterdam Centrum, Amsterdam
 More info
Office space in Amsterdam Centrum, Amsterdam
Office space for rent in Amsterdam Centrum, Amsterdam
Areal
Ca. 15 m2
Pris pr. md.
Ca. 850 EUR pr md
Område
Amsterdam Centrum, Amsterdam
Type
Office space
Office space in Aarhus C, Aarhus
More info
Office space in Aarhus C, Aarhus
Office space for rent in Aarhus C, Aarhus
Areal
Ca. 145 m2
Pris pr. md.
Ca. 11,800 DKK pr md
Område
Aarhus C, Aarhus
Type
Office space
Selected customers
30,000 customers use Companyspace.com
30,000 customers
285,000 companies in our database
2,400 rentals annually
Companyspace.com is used by thousands of landlords, property companies, commercial real estate agents, investors and business centres seeking greater visibility, more enquiries and lower vacancy rates.


