


Commercial premises for rent in Europe
There are 281,903 available commercial properties in Europe right now. Companyspace.com collects commercial properties from many different parts of the market, so that you as a company can more easily get an overview of available commercial properties in Europe.
Companyspace.com today:
New today 482
Updated 24h 1,491
Notifications about new companyspaces1,425
Copenhagen +2
Amsterdam +12
Vienna +1
Paris +5
Dublin (county) +48
Warsaw +12
Greater London +6
Latest update 30 min ago
Active ads 369,046
281,903 company spaces found
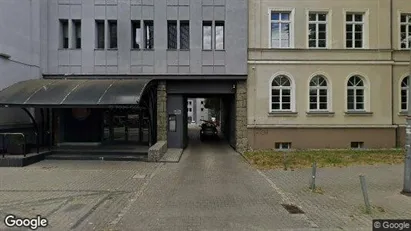
Office space in Katowice, Śląskie
 More info
Office space in Katowice, Śląskie
Office space for rent in Katowice, Śląskie
Areal
Ca. 95 m2
Pris pr. md.
Ca. 4,000 PLN pr md
Område
Katowice, Śląskie
Type
Office space
Office space in Holte, Greater Copenhagen
 More info
Office space in Holte, Greater Copenhagen
Office space for rent in Holte, Greater Copenhagen
Areal
Ca. 235 m2
Pris pr. md.
Not stated
Område
Holte, Greater Copenhagen
Type
Office space
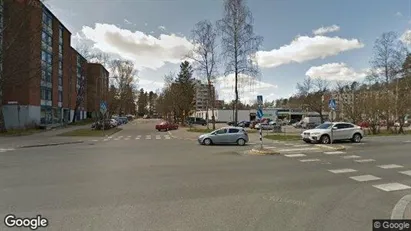
Commercial space in Vantaa, Uusimaa
 More info
Commercial space in Vantaa, Uusimaa
Commercial space for rent in Vantaa, Uusimaa
Areal
Ca. 50 m2
Pris pr. md.
Not stated
Område
Vantaa, Uusimaa
Type
Commercial property
Commercial space in Oud-Beijerland, South Holland
 More info
Commercial space in Oud-Beijerland, South Holland
Commercial space te huur in Oud-Beijerland, Zuid-Holland
Areal
Ca. 145 m2
Pris pr. md.
Ca. 1,600 EUR pr md
Område
Oud-Beijerland, South Holland
Type
Commercial property
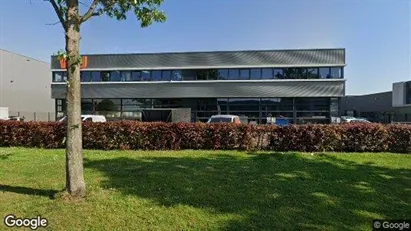
Office space in Haarlem, North Holland
 More info
Office space in Haarlem, North Holland
Office space for rent in Haarlem, North Holland
Areal
Ca. 1,080 m2
Pris pr. md.
Not stated
Område
Haarlem, North Holland
Type
Office space
Commercial space in Vantaa, Uusimaa
 More info
Commercial space in Vantaa, Uusimaa
Commercial space for rent in Vantaa, Uusimaa
Areal
Ca. 80 m2
Pris pr. md.
Not stated
Område
Vantaa, Uusimaa
Type
Commercial property
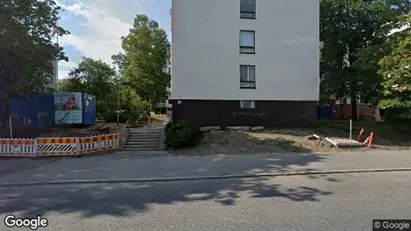
Office space in Frederiksberg C, Copenhagen
 More info
Office space in Frederiksberg C, Copenhagen
Office space for rent in Frederiksberg C, Copenhagen
Areal
Ca. 50 m2
Pris pr. md.
Not stated
Område
Frederiksberg C, Copenhagen
Type
Office space
Office space in Utrecht West, Utrecht
 More info
Office space in Utrecht West, Utrecht
Kantoor te huur in Utrecht West, Utrecht
Areal
23 - 46 m2
Pris pr. md.
Ca. 500 EUR pr md
Område
Utrecht West, Utrecht
Type
Office space
Office space in Purmerend, North Holland
 More info
Office space in Purmerend, North Holland
Office space for rent in Purmerend, North Holland
Areal
Ca. 110 m2
Pris pr. md.
Ca. 1,400 EUR pr md
Område
Purmerend, North Holland
Type
Office space
Commercial space in Napoli Municipalità 5, Napoli
 More info
Commercial space in Napoli Municipalità 5, Napoli
Commercial space for rent in Napoli Municipalità 5, Napoli
Areal
-
Pris pr. md.
Ca. 800 EUR pr md
Område
Napoli Municipalità 5, Napoli
Type
Commercial property
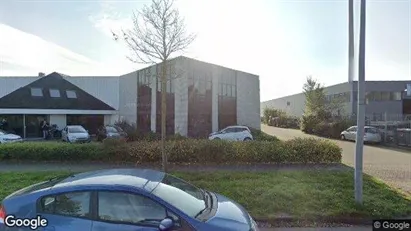
Office space in Antwerp Merksem, Antwerp
 More info
Office space in Antwerp Merksem, Antwerp
Office space for rent in Antwerp Merksem, Antwerp
Areal
Ca. 580 m2
Pris pr. md.
Ca. 2,900 EUR pr md
Område
Antwerp Merksem, Antwerp
Type
Office space
Commercial space in Alkmaar, North Holland
 More info
Commercial space in Alkmaar, North Holland
Commercial space for rent in Alkmaar, North Holland
Areal
Ca. 1,595 m2
Pris pr. md.
Ca. 8,200 EUR pr md
Område
Alkmaar, North Holland
Type
Commercial property
Office space in Breda, North Brabant
 More info
Office space in Breda, North Brabant
Office space for rent in Breda, North Brabant
Areal
Ca. 110 m2
Pris pr. md.
Ca. 1,750 EUR pr md
Område
Breda, North Brabant
Type
Office space
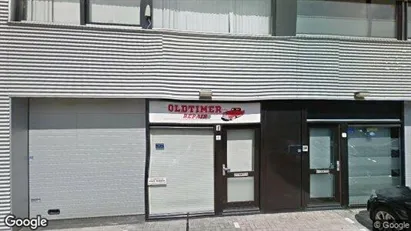
Commercial space in Nissewaard, South Holland
 More info
Commercial space in Nissewaard, South Holland
Commercial space for rent in Nissewaard, South Holland
Areal
Ca. 170 m2
Pris pr. md.
Ca. 1,750 EUR pr md
Område
Nissewaard, South Holland
Type
Commercial property
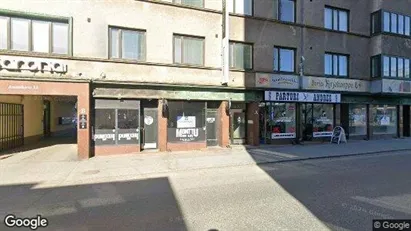
Commercial space in Pori, Satakunta
 More info
Commercial space in Pori, Satakunta
Commercial space for rent in Pori, Satakunta
Areal
Ca. 20 m2
Pris pr. md.
Ca. 300 EUR pr md
Område
Pori, Satakunta
Type
Commercial property
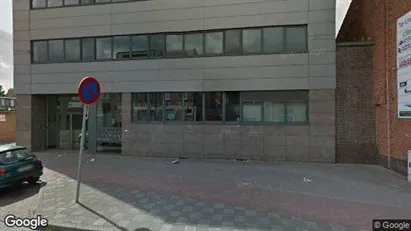
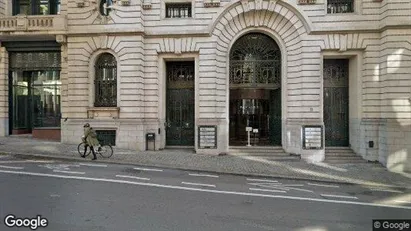
Office space in Stad Brussel, Brussels
 More info
Office space in Stad Brussel, Brussels
Office space for rent in Stad Brussel, Brussels
Areal
Ca. 20 m2
Pris pr. md.
Ca. 1,150 EUR pr md
Område
Stad Brussel, Brussels
Type
Office space
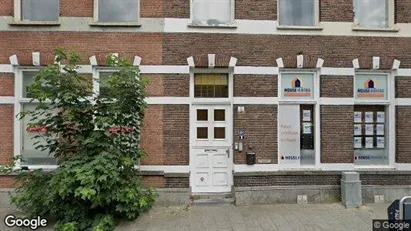
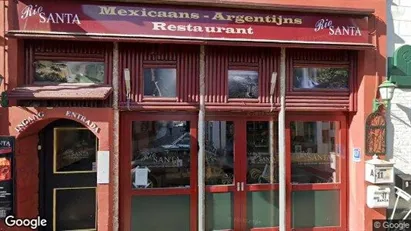
Commercial space in Goes, Zeeland
 More info
Commercial space in Goes, Zeeland
Commercial space te huur in Goes, Zeeland
Areal
Ca. 105 m2
Pris pr. md.
Ca. 2,500 EUR pr md
Område
Goes, Zeeland
Type
Commercial property
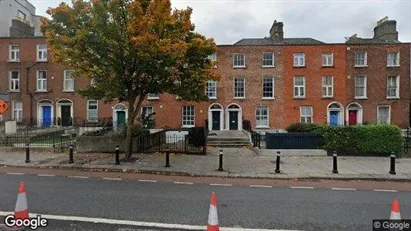
Office space in Dublin 1, Dublin
 More info
Office space in Dublin 1, Dublin
Office space for rent in Dublin 1, Dublin
Areal
Ca. 20 m2
Pris pr. md.
Ca. 600 EUR pr md
Område
Dublin 1, Dublin
Type
Office space
Selected customers
30,000 customers use Companyspace.com
30,000 customers
285,000 companies in our database
2,400 rentals annually
Companyspace.com is used by thousands of landlords, property companies, commercial real estate agents, investors and business centres seeking greater visibility, more enquiries and lower vacancy rates.


