


Commercial premises for rent in Europe
There are 282,062 available commercial properties in Europe right now. Companyspace.com collects commercial properties from many different parts of the market, so that you as a company can more easily get an overview of available commercial properties in Europe.
Companyspace.com today:
New today 541
Updated 24h 1,530
Notifications about new companyspaces2,001
Copenhagen +2
Amsterdam +12
Berlin +1
Vienna +15
Paris +5
Dublin (county) +48
Warsaw +12
Greater London +6
Latest update 22 min ago
Active ads 369,195
282,062 company spaces found
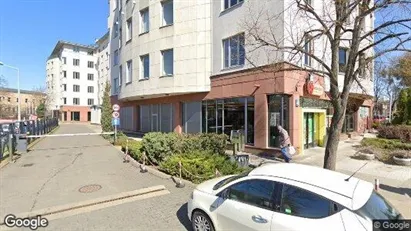
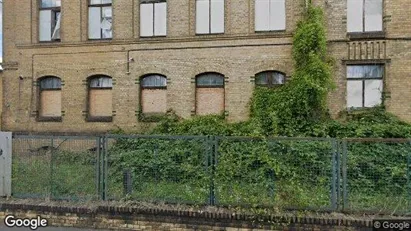
Commercial space in Warszawa Wola, Warsaw
 More info
Commercial space in Warszawa Wola, Warsaw
Commercial space Do wynajęciaWarszawa Wola, Warsaw
Areal
Ca. 380 m2
Pris pr. md.
Not stated
Område
Warszawa Wola, Warsaw
Type
Commercial property
Office space in Almere, Flevoland
 More info
Office space in Almere, Flevoland
Office space for rent in Almere, Flevoland
Areal
Ca. 15 m2
Pris pr. md.
Ca. 600 EUR pr md
Område
Almere, Flevoland
Type
Office space
Commercial space in Stad Antwerp, Antwerp
 More info
Commercial space in Stad Antwerp, Antwerp
Commercial space for rent in Stad Antwerp, Antwerp
Areal
Ca. 60 m2
Pris pr. md.
Ca. 1,300 EUR pr md
Område
Stad Antwerp, Antwerp
Type
Commercial property
Commercial space in Vesterbro, Copenhagen
 More info
Commercial space in Vesterbro, Copenhagen
Commercial space for rent in Vesterbro, Copenhagen
Areal
Ca. 25 m2
Pris pr. md.
Ca. 2,850 DKK pr md
Område
Vesterbro, Copenhagen
Type
Commercial property
Office space in Vianen, Province of Utrecht
 More info
Office space in Vianen, Province of Utrecht
Office space for rent in Vianen, Province of Utrecht
Areal
-
Pris pr. md.
Ca. 1,250 EUR pr md
Område
Vianen, Province of Utrecht
Type
Office space
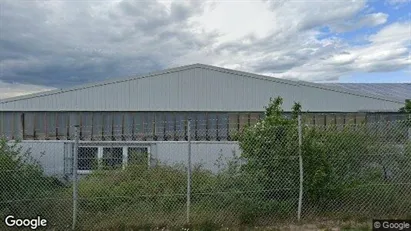
Warehouse in Mecklenburgische Seenplatte, Mecklenburg-Vorpommern
 More info
Warehouse in Mecklenburgische Seenplatte, Mecklenburg-Vorpommern
Warehouse for rent in Mecklenburgische Seenplatte, Mecklenburg-Vorpommern
Areal
Ca. 155 m2
Pris pr. md.
Not stated
Område
Mecklenburgische Seenplatte, Mecklenburg-Vorpommern
Type
Warehouse
Warehouse in Lichtervelde, West-Vlaanderen
 More info
Warehouse in Lichtervelde, West-Vlaanderen
Warehouse for rent in Lichtervelde, West-Vlaanderen
Areal
Ca. 305 m2
Pris pr. md.
Ca. 750 EUR pr md
Område
Lichtervelde, West-Vlaanderen
Type
Warehouse
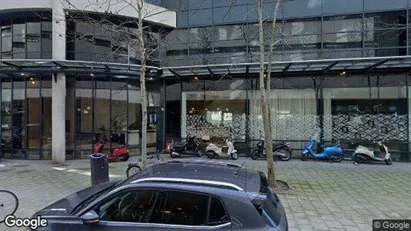
Office space in Rotterdam Centrum, Rotterdam
 More info
Office space in Rotterdam Centrum, Rotterdam
Office space for rent in Rotterdam Centrum, Rotterdam
Areal
Ca. 15 m2
Pris pr. md.
Ca. 750 EUR pr md
Område
Rotterdam Centrum, Rotterdam
Type
Office space
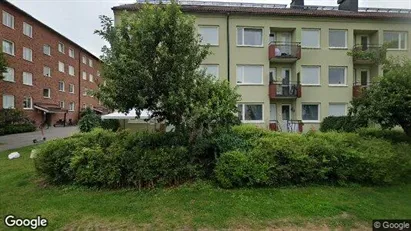
Commercial space in Norrköping, Östergötland County
 More info
Commercial space in Norrköping, Östergötland County
Commercial space for rent in Norrköping, Östergötland County
Areal
Ca. 60 m2
Pris pr. md.
Ca. 8,450 SEK pr md
Område
Norrköping, Östergötland County
Type
Commercial property
Commercial space in Warszawa Włochy, Warsaw
 More info
Commercial space in Warszawa Włochy, Warsaw
Commercial space Do wynajęciaWarszawa Włochy, Warsaw
Areal
Ca. 1,165 m2
Pris pr. md.
Not stated
Område
Warszawa Włochy, Warsaw
Type
Commercial property
Commercial space in Warszawa Wola, Warsaw
 More info
Commercial space in Warszawa Wola, Warsaw
Commercial space Do wynajęciaWarszawa Wola, Warsaw
Areal
Ca. 35 m2
Pris pr. md.
Not stated
Område
Warszawa Wola, Warsaw
Type
Commercial property
Office space in Amsterdam-Zuidoost, Amsterdam
 More info
Office space in Amsterdam-Zuidoost, Amsterdam
Office space for rent in Amsterdam-Zuidoost, Amsterdam
Areal
Ca. 45 m2
Pris pr. md.
Ca. 2,250 EUR pr md
Område
Amsterdam-Zuidoost, Amsterdam
Type
Office space
Office space in Hasselt, Limburg
 More info
Office space in Hasselt, Limburg
Office space for rent in Hasselt, Limburg
Areal
Ca. 405 m2
Pris pr. md.
Ca. 5,250 EUR pr md
Område
Hasselt, Limburg
Type
Office space
Commercial space in Warszawa Mokotów, Warsaw
 More info
Commercial space in Warszawa Mokotów, Warsaw
Commercial space Do wynajęciaWarszawa Mokotów, Warsaw
Areal
Ca. 290 m2
Pris pr. md.
Not stated
Område
Warszawa Mokotów, Warsaw
Type
Commercial property
Commercial space in Warszawa Ursynów, Warsaw
 More info
Commercial space in Warszawa Ursynów, Warsaw
Commercial space Do wynajęciaWarszawa Ursynów, Warsaw
Areal
Ca. 955 m2
Pris pr. md.
Not stated
Område
Warszawa Ursynów, Warsaw
Type
Commercial property
Office space in Kempele, Pohjois-Pohjanmaa
 More info
Office space in Kempele, Pohjois-Pohjanmaa
Office space for rent in Kempele, Pohjois-Pohjanmaa
Areal
Ca. 445 m2
Pris pr. md.
Not stated
Område
Kempele, Pohjois-Pohjanmaa
Type
Office space
Office space in Leipzig, Sachsen
 More info
Office space in Leipzig, Sachsen
Office space for rent in Leipzig, Sachsen
Areal
Ca. 750 m2
Pris pr. md.
Not stated
Område
Leipzig, Sachsen
Type
Office space
Warehouse in Taastrup, Greater Copenhagen
 More info
Warehouse in Taastrup, Greater Copenhagen
Warehouse for rent in Taastrup, Greater Copenhagen
Areal
Ca. 2,590 m2
Pris pr. md.
Ca. 145,600 DKK pr md
Område
Taastrup, Greater Copenhagen
Type
Warehouse
Selected customers
30,000 customers use Companyspace.com
30,000 customers
285,000 companies in our database
2,400 rentals annually
Companyspace.com is used by thousands of landlords, property companies, commercial real estate agents, investors and business centres seeking greater visibility, more enquiries and lower vacancy rates.


