


Commercial premises for rent in Europe
There are 284,056 available commercial properties in Europe right now. Companyspace.com collects commercial properties from many different parts of the market, so that you as a company can more easily get an overview of available commercial properties in Europe.
Companyspace.com today:
New today 2,911
Updated 24h 3,925
Notifications about new companyspaces2,103
Copenhagen +4
Stockholm +1
Amsterdam +3
Berlin +3
Vienna +6
Paris +5
Madrid +4
Dublin (county) +23
Warsaw +19
Greater London +13
Latest update 55 min ago
Active ads 369,195
284,056 company spaces found
Warehouse in Lokeren, Oost-Vlaanderen
 More info
Warehouse in Lokeren, Oost-Vlaanderen
Warehouse for rent in Lokeren, Oost-Vlaanderen
Areal
Ca. 2,325 m2
Pris pr. md.
Ca. 11,900 EUR pr md
Område
Lokeren, Oost-Vlaanderen
Type
Warehouse
Office space in Terrassa, Cataluña
 More info
Office space in Terrassa, Cataluña
Office space for rent in Terrassa, Cataluña
Areal
Ca. 50 m2
Pris pr. md.
Ca. 450 EUR pr md
Område
Terrassa, Cataluña
Type
Office space
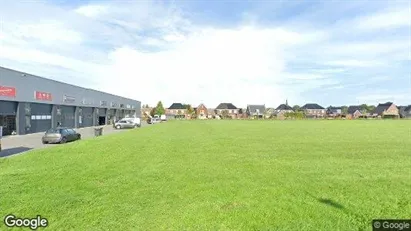
Commercial space in Heusden-Zolder, Limburg
 More info
Commercial space in Heusden-Zolder, Limburg
Commercial space for rent in Heusden-Zolder, Limburg
Areal
-
Pris pr. md.
Ca. 1,100 EUR pr md
Område
Heusden-Zolder, Limburg
Type
Commercial property
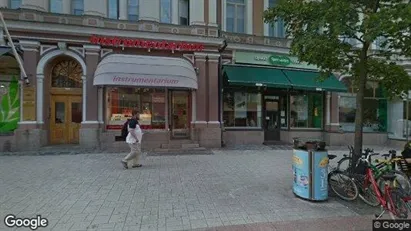
Commercial space in Turku, Varsinais-Suomi
 More info
Commercial space in Turku, Varsinais-Suomi
Commercial space for rent in Turku, Varsinais-Suomi
Areal
Ca. 220 m2
Pris pr. md.
Not stated
Område
Turku, Varsinais-Suomi
Type
Commercial property
Office space in London W6, Greater London
 More info
Office space in London W6, Greater London
Office space for rent in London W6, Greater London
Areal
-
Pris pr. md.
Ca. 3,000 GBP pr md
Område
London W6, Greater London
Type
Office space
Office space in Almere, Flevoland
 More info
Office space in Almere, Flevoland
Office space for rent in Almere, Flevoland
Areal
Ca. 20 m2
Pris pr. md.
Ca. 750 EUR pr md
Område
Almere, Flevoland
Type
Office space
Commercial space in Oldenzaal, Overijssel
 More info
Commercial space in Oldenzaal, Overijssel
Commercial space te huur in Oldenzaal, Overijssel
Areal
Ca. 1,710 m2
Pris pr. md.
Ca. 11,650 EUR pr md
Område
Oldenzaal, Overijssel
Type
Commercial property
Office space in The Hague Centrum, The Hague
 More info
Office space in The Hague Centrum, The Hague
Office space for rent in The Hague Centrum, The Hague
Areal
-
Pris pr. md.
Ca. 300 EUR pr md
Område
The Hague Centrum, The Hague
Type
Office space
Commercial space in Nuth, Limburg
 More info
Commercial space in Nuth, Limburg
Commercial space for rent in Nuth, Limburg
Areal
Ca. 150 m2
Pris pr. md.
Ca. 1,000 EUR pr md
Område
Nuth, Limburg
Type
Commercial property
Commercial space in Boxmeer, North Brabant
 More info
Commercial space in Boxmeer, North Brabant
Te huur per direct: nieuwe gebruiksklare bedrijfsunits in bedrijvencentrum Sterckwijck in Beugen/Boxmeer.
Het bedrijventerrein heeft een prima ontsluiting...
Areal
Ca. 255 m2
Pris pr. md.
Ca. 8,350 EUR pr md
Område
Boxmeer, North Brabant
Type
Commercial property
Commercial space in Ridderkerk, South Holland
 More info
Commercial space in Ridderkerk, South Holland
Commercial space for rent in Ridderkerk, South Holland
Areal
Ca. 11,620 m2
Pris pr. md.
Not stated
Område
Ridderkerk, South Holland
Type
Commercial property
Office space in Turku, Varsinais-Suomi
 More info
Office space in Turku, Varsinais-Suomi
Office space for rent in Turku, Varsinais-Suomi
Areal
-
Pris pr. md.
Not stated
Område
Turku, Varsinais-Suomi
Type
Office space
Industrial property in Oulu, Pohjois-Pohjanmaa
 More info
Industrial property in Oulu, Pohjois-Pohjanmaa
Industrial property for rent in Oulu, Pohjois-Pohjanmaa
Areal
Ca. 765 m2
Pris pr. md.
Ca. 4,950 EUR pr md
Område
Oulu, Pohjois-Pohjanmaa
Type
Industrial property
Office space in Sønderborg, Region of Southern Denmark
 More info
Office space in Sønderborg, Region of Southern Denmark
Office space for rent in Sønderborg, Region of Southern Denmark
Areal
Ca. 400 m2
Pris pr. md.
Ca. 23,350 DKK pr md
Område
Sønderborg, Region of Southern Denmark
Type
Office space
Office space in Eindhoven, North Brabant
 More info
Office space in Eindhoven, North Brabant
Office space for rent in Eindhoven, North Brabant
Areal
-
Pris pr. md.
Not stated
Område
Eindhoven, North Brabant
Type
Office space
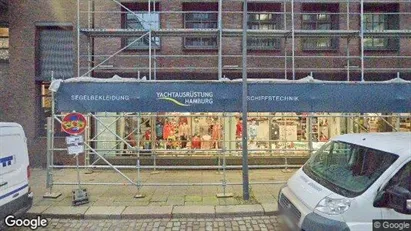
Office space in Hamburg Mitte, Hamburg
 More info
Office space in Hamburg Mitte, Hamburg
Office space for rent in Hamburg Mitte, Hamburg
Areal
761 - 1,537 m2
Pris pr. md.
Not stated
Område
Hamburg Mitte, Hamburg
Type
Office space
Office space in Copenhagen K, Copenhagen
More info
Office space in Copenhagen K, Copenhagen
Office space for rent in Copenhagen K, Copenhagen
Areal
Ca. 70 m2
Pris pr. md.
Not stated
Område
Copenhagen K, Copenhagen
Type
Office space
Office space in Eindhoven, North Brabant
 More info
Office space in Eindhoven, North Brabant
Office space for rent in Eindhoven, North Brabant
Areal
Ca. 30 m2
Pris pr. md.
Ca. 750 EUR pr md
Område
Eindhoven, North Brabant
Type
Office space
Selected customers
30,000 customers use Companyspace.com
30,000 customers
285,000 companies in our database
2,400 rentals annually
Companyspace.com is used by thousands of landlords, property companies, commercial real estate agents, investors and business centres seeking greater visibility, more enquiries and lower vacancy rates.


