


Commercial premises for rent in Europe
There are 281,974 available commercial properties in Europe right now. Companyspace.com collects commercial properties from many different parts of the market, so that you as a company can more easily get an overview of available commercial properties in Europe.
Companyspace.com today:
New today 520
Updated 24h 1,529
Notifications about new companyspaces1,785
Copenhagen +2
Amsterdam +12
Berlin +1
Vienna +15
Paris +5
Dublin (county) +48
Warsaw +12
Greater London +6
Latest update 19 min ago
Active ads 369,117
281,974 company spaces found
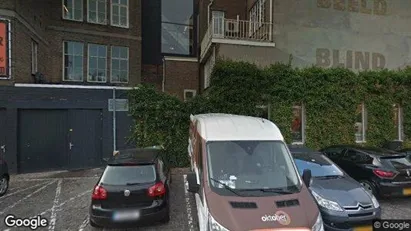
Clinic in Kastrup, Copenhagen
 More info
Clinic in Kastrup, Copenhagen
Clinic for rent in Kastrup, Copenhagen
Areal
Ca. 55 m2
Pris pr. md.
Ca. 9,000 DKK pr md
Område
Kastrup, Copenhagen
Type
Clinic
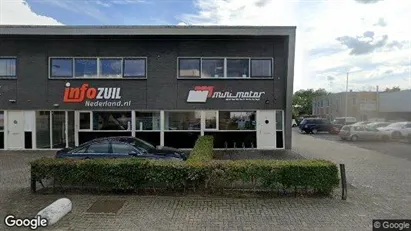
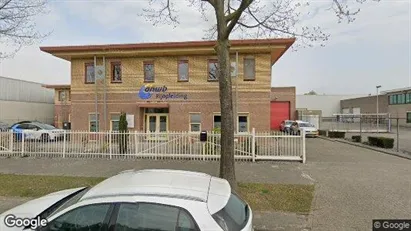
Commercial space in Woerden, Province of Utrecht
 More info
Commercial space in Woerden, Province of Utrecht
Commercial space for rent in Woerden, Province of Utrecht
Areal
Ca. 105 m2
Pris pr. md.
Ca. 1,750 EUR pr md
Område
Woerden, Province of Utrecht
Type
Commercial property
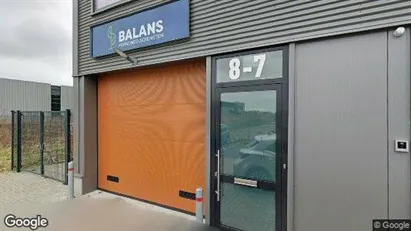
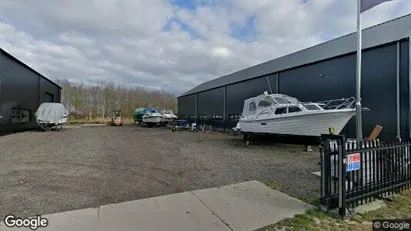
Industrial property in Sulsted, North Jutland Region
 More info
Industrial property in Sulsted, North Jutland Region
Industrial property for rent in Sulsted, North Jutland Region
Areal
Ca. 600 m2
Pris pr. md.
Ca. 10,000 DKK pr md
Område
Sulsted, North Jutland Region
Type
Industrial property
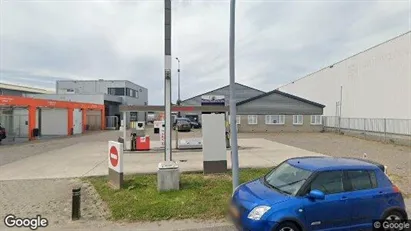
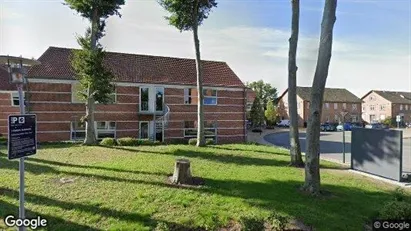
Commercial space in Maasdriel, Gelderland
 More info
Commercial space in Maasdriel, Gelderland
Commercial space for rent in Maasdriel, Gelderland
Areal
Ca. 375 m2
Pris pr. md.
Ca. 2,650 EUR pr md
Område
Maasdriel, Gelderland
Type
Commercial property
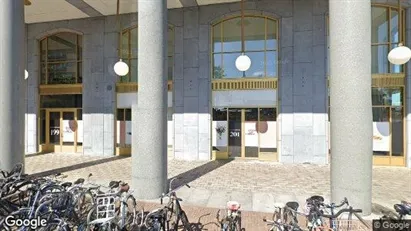
Office space in Utrecht Leidsche Rijn, Utrecht
 More info
Office space in Utrecht Leidsche Rijn, Utrecht
Office space for rent in Utrecht Leidsche Rijn, Utrecht
Areal
Ca. 10 m2
Pris pr. md.
Ca. 250 EUR pr md
Område
Utrecht Leidsche Rijn, Utrecht
Type
Office space
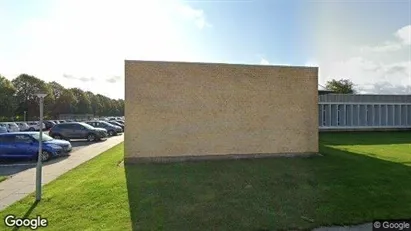
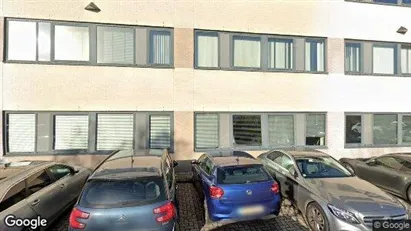
Office space in Berlin Friedrichshain-Kreuzberg, Berlin
 More info
Office space in Berlin Friedrichshain-Kreuzberg, Berlin
Office space for rent in Berlin Friedrichshain-Kreuzberg, Berlin
Areal
Ca. 235 m2
Pris pr. md.
Not stated
Område
Berlin Friedrichshain-Kreuzberg, Berlin
Type
Office space
Office space in Herning, Central Jutland Region
 More info
Office space in Herning, Central Jutland Region
Office space for rent in Herning, Central Jutland Region
Areal
Ca. 335 m2
Pris pr. md.
Ca. 14,750 DKK pr md
Område
Herning, Central Jutland Region
Type
Office space
Office space in Utrecht West, Utrecht
 More info
Office space in Utrecht West, Utrecht
Kantoor te huur in Utrecht West, Utrecht
Areal
20 - 440 m2
Pris pr. md.
Ca. 650 EUR pr md
Område
Utrecht West, Utrecht
Type
Office space
Commercial space in Eindhoven, North Brabant
 More info
Commercial space in Eindhoven, North Brabant
Commercial space for rent in Eindhoven, North Brabant
Areal
Ca. 500 m2
Pris pr. md.
Ca. 400 EUR pr md
Område
Eindhoven, North Brabant
Type
Commercial property
Commercial space in Binnenmaas, South Holland
 More info
Commercial space in Binnenmaas, South Holland
Commercial space for rent in Binnenmaas, South Holland
Areal
-
Pris pr. md.
Ca. 1,650 EUR pr md
Område
Binnenmaas, South Holland
Type
Commercial property
Office space in Aarhus C, Aarhus
 More info
Office space in Aarhus C, Aarhus
Office space for rent in Aarhus C, Aarhus
Areal
Ca. 740 m2
Pris pr. md.
Ca. 86,450 DKK pr md
Område
Aarhus C, Aarhus
Type
Office space
Office space in Tampere Keskinen, Tampere
 More info
Office space in Tampere Keskinen, Tampere
Toimistotila Vuokrattavana sisälläTampere Keskinen, Tampere
Areal
Ca. 235 m2
Pris pr. md.
Ca. 3,800 EUR pr md
Område
Tampere Keskinen, Tampere
Type
Office space
Commercial space in Leeuwarden, Friesland NL
 More info
Commercial space in Leeuwarden, Friesland NL
Op deze toplocatie op de Dobbe 17 te Grou,
op bedrijventerrein Frisia aan het water, komt in deze recent gebouwde (2024) bedrijfshal per 1 juli een bedrij...
Areal
Ca. 60 m2
Pris pr. md.
Ca. 8,350 EUR pr md
Område
Leeuwarden, Friesland NL
Type
Commercial property
Commercial space in Frankfurt West, Frankfurt (region)
 More info
Commercial space in Frankfurt West, Frankfurt (region)
Commercial space for rent in Frankfurt West, Frankfurt (region)
Areal
Ca. 270 m2
Pris pr. md.
Ca. 3,600 EUR pr md
Område
Frankfurt West, Frankfurt (region)
Type
Commercial property
Industrial property in Eindhoven, North Brabant
 More info
Industrial property in Eindhoven, North Brabant
Industrial property for rent in Eindhoven, North Brabant
Areal
Ca. 615 m2
Pris pr. md.
Ca. 400 EUR pr md
Område
Eindhoven, North Brabant
Type
Industrial property
Office space in Eindhoven, North Brabant
 More info
Office space in Eindhoven, North Brabant
Office space for rent in Eindhoven, North Brabant
Areal
Ca. 85 m2
Pris pr. md.
Ca. 250 EUR pr md
Område
Eindhoven, North Brabant
Type
Office space
Office space in Middelfart, Funen
 More info
Office space in Middelfart, Funen
Office space for rent in Middelfart, Funen
Areal
Ca. 45 m2
Pris pr. md.
Ca. 3,850 DKK pr md
Område
Middelfart, Funen
Type
Office space
Commercial space in Helsinki Eteläinen, Helsinki
 More info
Commercial space in Helsinki Eteläinen, Helsinki
Commercial space Vuokrattavana sisälläHelsinki Eteläinen, Helsinki
Areal
Ca. 30 m2
Pris pr. md.
Ca. 50 EUR pr md
Område
Helsinki Eteläinen, Helsinki
Type
Commercial property
Selected customers
30,000 customers use Companyspace.com
30,000 customers
285,000 companies in our database
2,400 rentals annually
Companyspace.com is used by thousands of landlords, property companies, commercial real estate agents, investors and business centres seeking greater visibility, more enquiries and lower vacancy rates.


