


Commercial premises for rent in Europe
There are 282,062 available commercial properties in Europe right now. Companyspace.com collects commercial properties from many different parts of the market, so that you as a company can more easily get an overview of available commercial properties in Europe.
Companyspace.com today:
New today 541
Updated 24h 1,530
Notifications about new companyspaces2,001
Copenhagen +2
Amsterdam +12
Berlin +1
Vienna +15
Paris +5
Dublin (county) +48
Warsaw +12
Greater London +6
Latest update 22 min ago
Active ads 369,195
282,062 company spaces found
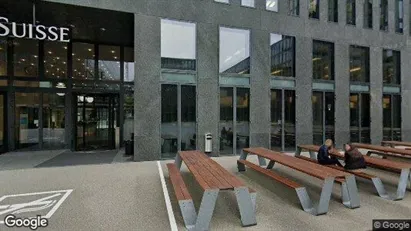
Office space in Zürich Distrikt 11, Zürich
 More info
Office space in Zürich Distrikt 11, Zürich
Office space for rent in Zürich Distrikt 11, Zürich
Areal
Ca. 36,000 m2
Pris pr. md.
Not stated
Område
Zürich Distrikt 11, Zürich
Type
Office space
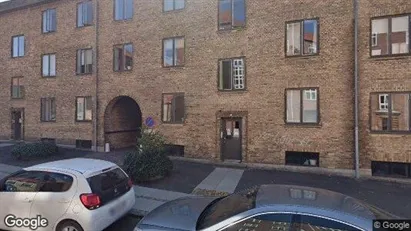
Office space in Copenhagen K, Copenhagen
 More info
Office space in Copenhagen K, Copenhagen
Office space for rent in Copenhagen K, Copenhagen
Areal
Ca. 280 m2
Pris pr. md.
Not stated
Område
Copenhagen K, Copenhagen
Type
Office space
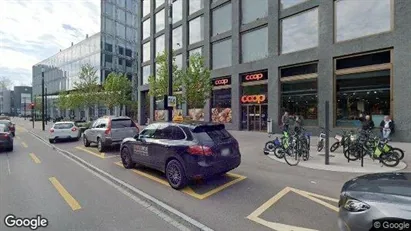
Office space in Bülach, Zürich (Kantone)
 More info
Office space in Bülach, Zürich (Kantone)
Office space for rent in Bülach, Zürich (Kantone)
Areal
Ca. 2,120 m2
Pris pr. md.
Not stated
Område
Bülach, Zürich (Kantone)
Type
Office space
Commercial space in Frederiksberg, Copenhagen
 More info
Commercial space in Frederiksberg, Copenhagen
Commercial space for rent in Frederiksberg, Copenhagen
Areal
-
Pris pr. md.
Not stated
Område
Frederiksberg, Copenhagen
Type
Commercial property
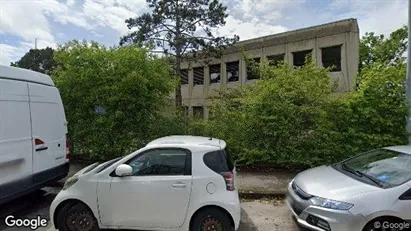
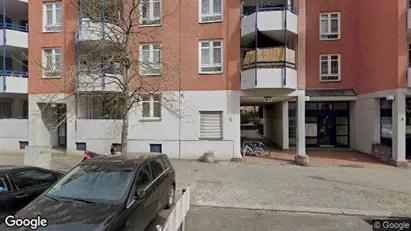
Office space in Vesterbro, Copenhagen
More info
Office space in Vesterbro, Copenhagen
Office space for rent in Vesterbro, Copenhagen
Areal
Ca. 755 m2
Pris pr. md.
Not stated
Område
Vesterbro, Copenhagen
Type
Office space
Commercial space in Hellerup, Greater Copenhagen
 More info
Commercial space in Hellerup, Greater Copenhagen
Commercial space for rent in Hellerup, Greater Copenhagen
Areal
-
Pris pr. md.
Not stated
Område
Hellerup, Greater Copenhagen
Type
Commercial property
Office space in Copenhagen K, Copenhagen
More info
Office space in Copenhagen K, Copenhagen
Office space for rent in Copenhagen K, Copenhagen
Areal
Ca. 335 m2
Pris pr. md.
Not stated
Område
Copenhagen K, Copenhagen
Type
Office space
Office space in Copenhagen K, Copenhagen
More info
Office space in Copenhagen K, Copenhagen
Office space for rent in Copenhagen K, Copenhagen
Areal
Ca. 330 m2
Pris pr. md.
Not stated
Område
Copenhagen K, Copenhagen
Type
Office space
Office space in Copenhagen K, Copenhagen
More info
Office space in Copenhagen K, Copenhagen
Office space for rent in Copenhagen K, Copenhagen
Areal
Ca. 175 m2
Pris pr. md.
Not stated
Område
Copenhagen K, Copenhagen
Type
Office space
Industrial property in Satigny, Geneva (Kantone)
 More info
Industrial property in Satigny, Geneva (Kantone)
Industrial property for rent in Satigny, Geneva (Kantone)
Areal
Ca. 1,940 m2
Pris pr. md.
Not stated
Område
Satigny, Geneva (Kantone)
Type
Industrial property
Office space in Lausanne, Waadt (Kantone)
 More info
Office space in Lausanne, Waadt (Kantone)
Office space for rent in Lausanne, Waadt (Kantone)
Areal
Ca. 1,295 m2
Pris pr. md.
Not stated
Område
Lausanne, Waadt (Kantone)
Type
Office space
Commercial space in Dyssegård, Greater Copenhagen
 More info
Commercial space in Dyssegård, Greater Copenhagen
Commercial space for rent in Dyssegård, Greater Copenhagen
Areal
-
Pris pr. md.
Not stated
Område
Dyssegård, Greater Copenhagen
Type
Commercial property
Commercial space in Berlin Mitte, Berlin
 More info
Commercial space in Berlin Mitte, Berlin
Commercial space for rent in Berlin Mitte, Berlin
Areal
Ca. 10 m2
Pris pr. md.
Ca. 150 EUR pr md
Område
Berlin Mitte, Berlin
Type
Commercial property
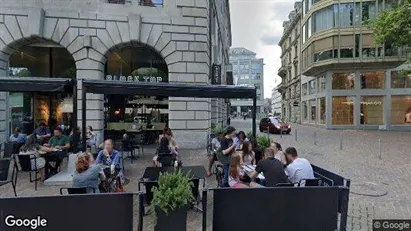
Office space in Zürich District 1 - Altstadt, Zürich
 More info
Office space in Zürich District 1 - Altstadt, Zürich
Office space for rent in Zürich District 1 - Altstadt, Zürich
Areal
Ca. 3,900 m2
Pris pr. md.
Not stated
Område
Zürich District 1 - Altstadt, Zürich
Type
Office space
Commercial space in Starnberg, Bayern
 More info
Commercial space in Starnberg, Bayern
Commercial space for rent in Starnberg, Bayern
Areal
Ca. 50 m2
Pris pr. md.
Ca. 1,700 EUR pr md
Område
Starnberg, Bayern
Type
Commercial property
Office space in Berlin Tempelhof-Schöneberg, Berlin
 More info
Office space in Berlin Tempelhof-Schöneberg, Berlin
Office space for rent in Berlin Tempelhof-Schöneberg, Berlin
Areal
25 - 26 m2
Pris pr. md.
Ca. 100 EUR pr md
Område
Berlin Tempelhof-Schöneberg, Berlin
Type
Office space
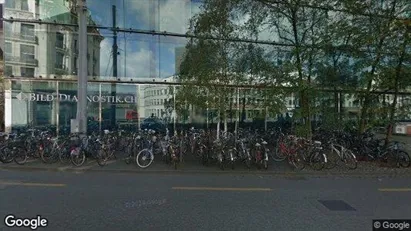
Office space in Basel-Stadt, Basel-Stadt (Kantone)
 More info
Office space in Basel-Stadt, Basel-Stadt (Kantone)
Office space for rent in Basel-Stadt, Basel-Stadt (Kantone)
Areal
Ca. 3,300 m2
Pris pr. md.
Not stated
Område
Basel-Stadt, Basel-Stadt (Kantone)
Type
Office space
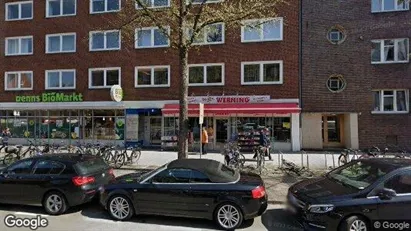
Office space in Münster, Nordrhein-Westfalen
 More info
Office space in Münster, Nordrhein-Westfalen
Office space for rent in Münster, Nordrhein-Westfalen
Areal
35 - 36 m2
Pris pr. md.
Ca. 100 EUR pr md
Område
Münster, Nordrhein-Westfalen
Type
Office space
Selected customers
30,000 customers use Companyspace.com
30,000 customers
285,000 companies in our database
2,400 rentals annually
Companyspace.com is used by thousands of landlords, property companies, commercial real estate agents, investors and business centres seeking greater visibility, more enquiries and lower vacancy rates.


