


Commercial premises for rent in Europe
There are 282,277 available commercial properties in Europe right now. Companyspace.com collects commercial properties from many different parts of the market, so that you as a company can more easily get an overview of available commercial properties in Europe.
Companyspace.com today:
New today 268
Updated 24h 1,330
Notifications about new companyspaces23
Copenhagen +2
Vienna +1
Paris +5
Dublin (county) +48
Warsaw +12
Greater London +1
Latest update 1 min ago
Active ads 369,502
282,277 company spaces found
Commercial space in Łódź, Łódzkie
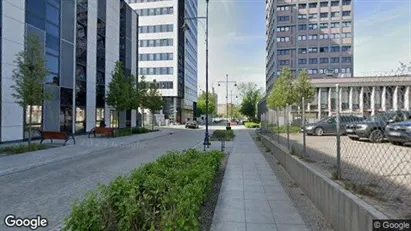 More info
Commercial space in Łódź, Łódzkie
Commercial space for rent in Łódź, Łódzkie
Areal
Ca. 305 m2
Pris pr. md.
Ca. 6,150 PLN pr md
Område
Łódź, Łódzkie
Type
Commercial property
Commercial space in Barendrecht, South Holland
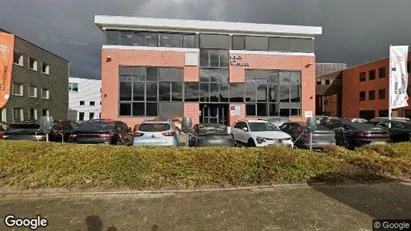 More info
Commercial space in Barendrecht, South Holland
Commercial space te huur in Barendrecht, Zuid-Holland
Areal
Ca. 1,520 m2
Pris pr. md.
Ca. 20,000 EUR pr md
Område
Barendrecht, South Holland
Type
Commercial property
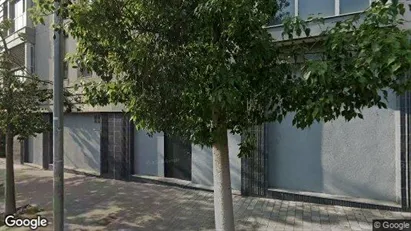
Office space in Oulu, Pohjois-Pohjanmaa
 More info
Office space in Oulu, Pohjois-Pohjanmaa
Office space for rent in Oulu, Pohjois-Pohjanmaa
Areal
Ca. 250 m2
Pris pr. md.
Not stated
Område
Oulu, Pohjois-Pohjanmaa
Type
Office space
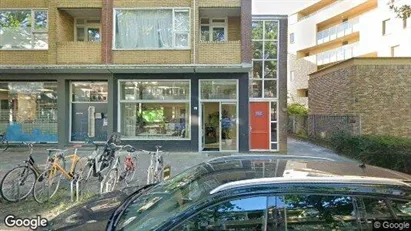
Office space in Vejle, Vejle (region)
 More info
Office space in Vejle, Vejle (region)
Office space for rent in Vejle, Vejle (region)
Areal
Ca. 340 m2
Pris pr. md.
Ca. 19,950 DKK pr md
Område
Vejle, Vejle (region)
Type
Office space
Shop in Noordwijk, South Holland
More info
We monitor the market!
Shop in Noordwijk, South Holland
Shop for rent in Noordwijk, South Holland
Areal
Ca. 310 m2
Pris pr. md.
Not stated
Område
Noordwijk, South Holland
Type
Shop
Office space in Terrassa, Cataluña
 More info
Office space in Terrassa, Cataluña
Office space for rent in Terrassa, Cataluña
Areal
Ca. 470 m2
Pris pr. md.
Ca. 3,500 EUR pr md
Område
Terrassa, Cataluña
Type
Office space
Industrial property in Pori, Satakunta
 More info
Industrial property in Pori, Satakunta
Industrial property for rent in Pori, Satakunta
Areal
Ca. 130 m2
Pris pr. md.
Ca. 600 EUR pr md
Område
Pori, Satakunta
Type
Industrial property
Office space in Groningen, Groningen (region)
 More info
Office space in Groningen, Groningen (region)
Office space for rent in Groningen, Groningen (region)
Areal
Ca. 155 m2
Pris pr. md.
Ca. 1,500 EUR pr md
Område
Groningen, Groningen (region)
Type
Office space
Office space in Uden, North Brabant
 More info
Office space in Uden, North Brabant
Office space for rent in Uden, North Brabant
Areal
Ca. 150 m2
Pris pr. md.
Ca. 650 EUR pr md
Område
Uden, North Brabant
Type
Office space
Office space in Leipzig, Sachsen
 More info
Office space in Leipzig, Sachsen
Office space for rent in Leipzig, Sachsen
Areal
Ca. 9,740 m2
Pris pr. md.
Not stated
Område
Leipzig, Sachsen
Type
Office space
Office space in Amsterdam Slotervaart, Amsterdam
 More info
Office space in Amsterdam Slotervaart, Amsterdam
Office space for rent in Amsterdam Slotervaart, Amsterdam
Areal
Ca. 720 m2
Pris pr. md.
Ca. 11,100 EUR pr md
Område
Amsterdam Slotervaart, Amsterdam
Type
Office space
Office space in Leipzig, Sachsen
 More info
Office space in Leipzig, Sachsen
Office space for rent in Leipzig, Sachsen
Areal
Ca. 905 m2
Pris pr. md.
Not stated
Område
Leipzig, Sachsen
Type
Office space
Office space in Mechelen, Antwerp (Province)
 More info
Office space in Mechelen, Antwerp (Province)
Office space for rent in Mechelen, Antwerp (Province)
Areal
Ca. 1,175 m2
Pris pr. md.
Ca. 3,950 EUR pr md
Område
Mechelen, Antwerp (Province)
Type
Office space
Office space in Esbjerg, Esbjerg (region)
 More info
Office space in Esbjerg, Esbjerg (region)
Office space for rent in Esbjerg, Esbjerg (region)
Areal
Ca. 465 m2
Pris pr. md.
Ca. 33,000 DKK pr md
Område
Esbjerg, Esbjerg (region)
Type
Office space
Office space in Leipzig, Sachsen
 More info
Office space in Leipzig, Sachsen
Office space for rent in Leipzig, Sachsen
Areal
Ca. 1,355 m2
Pris pr. md.
Not stated
Område
Leipzig, Sachsen
Type
Office space
Office space in Breda, North Brabant
 More info
Office space in Breda, North Brabant
Office space for rent in Breda, North Brabant
Areal
Ca. 100 m2
Pris pr. md.
Ca. 350 EUR pr md
Område
Breda, North Brabant
Type
Office space
Office space in Rijswijk, South Holland
 More info
Office space in Rijswijk, South Holland
Office space for rent in Rijswijk, South Holland
Areal
Ca. 10 m2
Pris pr. md.
Ca. 50 EUR pr md
Område
Rijswijk, South Holland
Type
Office space
Office space in Brussels Anderlecht, Brussels
 More info
Office space in Brussels Anderlecht, Brussels
Office space for rent in Brussels Anderlecht, Brussels
Areal
Ca. 15 m2
Pris pr. md.
Ca. 1,000 EUR pr md
Område
Brussels Anderlecht, Brussels
Type
Office space
Selected customers
30,000 customers use Companyspace.com
30,000 customers
285,000 companies in our database
2,400 rentals annually
Companyspace.com is used by thousands of landlords, property companies, commercial real estate agents, investors and business centres seeking greater visibility, more enquiries and lower vacancy rates.


