


Commercial premises for rent in Europe
There are 284,469 available commercial properties in Europe right now. Companyspace.com collects commercial properties from many different parts of the market, so that you as a company can more easily get an overview of available commercial properties in Europe.
Companyspace.com today:
New today 1,113
Updated 24h 2,182
Notifications about new companyspaces1,717
Copenhagen +3
Stockholm +2
Amsterdam +19
Berlin +1
Brussels +2
Vienna +7
Paris +7
Madrid +1
Dublin (county) +2
Warsaw +19
Lisbon +1
Greater London +17
Latest update 2 min ago
Active ads 370,351
284,469 company spaces found
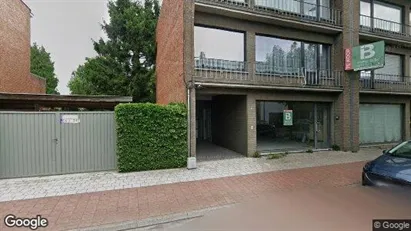
Office space in Wommelgem, Antwerp (Province)
 More info
Office space in Wommelgem, Antwerp (Province)
Office space for rent in Wommelgem, Antwerp (Province)
Areal
84 - 132 m2
Pris pr. md.
Ca. 900 EUR pr md
Område
Wommelgem, Antwerp (Province)
Type
Office space
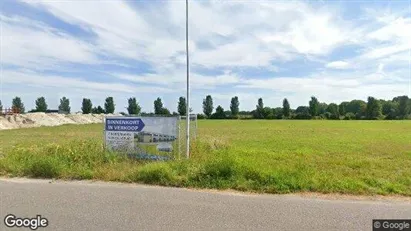
Commercial space in Bergeijk, North Brabant
 More info
Commercial space in Bergeijk, North Brabant
Commercial space for rent in Bergeijk, North Brabant
Areal
Ca. 765 m2
Pris pr. md.
Ca. 4,900 EUR pr md
Område
Bergeijk, North Brabant
Type
Commercial property
Office space in Silkeborg, Central Jutland Region
 More info
Office space in Silkeborg, Central Jutland Region
Office space for rent in Silkeborg, Central Jutland Region
Areal
Ca. 40 m2
Pris pr. md.
Ca. 6,000 DKK pr md
Område
Silkeborg, Central Jutland Region
Type
Office space
Commercial space in Schouwen-Duiveland, Zeeland
 More info
Commercial space in Schouwen-Duiveland, Zeeland
Commercial space for rent in Schouwen-Duiveland, Zeeland
Areal
Ca. 100 m2
Pris pr. md.
Ca. 850 EUR pr md
Område
Schouwen-Duiveland, Zeeland
Type
Commercial property
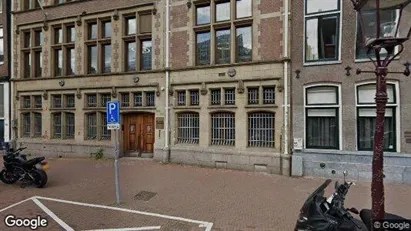
Office space in Amsterdam Centrum, Amsterdam
 More info
Office space in Amsterdam Centrum, Amsterdam
Office space for rent in Amsterdam Centrum, Amsterdam
Areal
Ca. 10 m2
Pris pr. md.
Ca. 100 EUR pr md
Område
Amsterdam Centrum, Amsterdam
Type
Office space
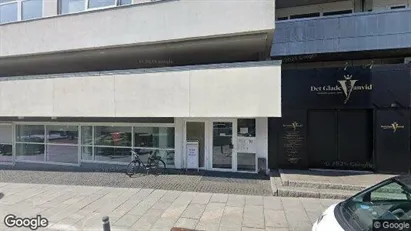
Office space in Odense C, Odense
 More info
Office space in Odense C, Odense
Office space for rent in Odense C, Odense
Areal
Ca. 415 m2
Pris pr. md.
Ca. 26,000 DKK pr md
Område
Odense C, Odense
Type
Office space
Office space in Amsterdam Zeeburg, Amsterdam
 More info
Office space in Amsterdam Zeeburg, Amsterdam
Office space for rent in Amsterdam Zeeburg, Amsterdam
Areal
Ca. 10 m2
Pris pr. md.
Ca. 100 EUR pr md
Område
Amsterdam Zeeburg, Amsterdam
Type
Office space
Commercial space in Twenterand, Overijssel
 More info
Commercial space in Twenterand, Overijssel
Commercial space for rent in Twenterand, Overijssel
Areal
Ca. 670 m2
Pris pr. md.
Ca. 1,400 EUR pr md
Område
Twenterand, Overijssel
Type
Commercial property
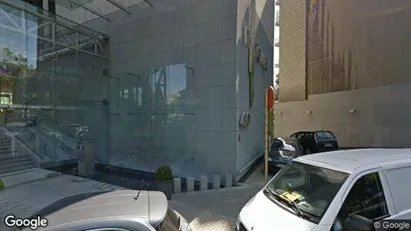
Office space in Brussels Elsene, Brussels
 More info
Office space in Brussels Elsene, Brussels
Office space for rent in Brussels Elsene, Brussels
Areal
Ca. 15 m2
Pris pr. md.
Ca. 1,450 EUR pr md
Område
Brussels Elsene, Brussels
Type
Office space
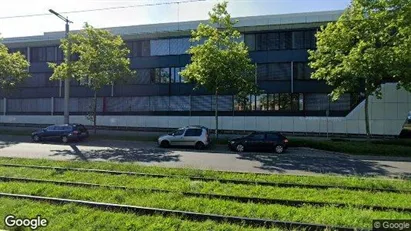
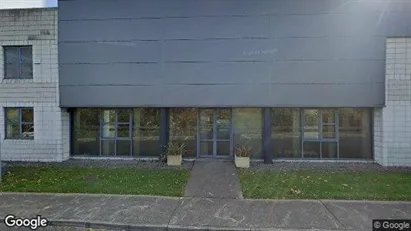
Office space in Leipzig, Sachsen
 More info
Office space in Leipzig, Sachsen
Office space for rent in Leipzig, Sachsen
Areal
Ca. 1,120 m2
Pris pr. md.
Not stated
Område
Leipzig, Sachsen
Type
Office space
Commercial space in Mol, Antwerp (Province)
 More info
Commercial space in Mol, Antwerp (Province)
Commercial space for rent in Mol, Antwerp (Province)
Areal
-
Pris pr. md.
Ca. 500 EUR pr md
Område
Mol, Antwerp (Province)
Type
Commercial property
Office space in Randers C, Randers
 More info
Office space in Randers C, Randers
Office space for rent in Randers C, Randers
Areal
Ca. 900 m2
Pris pr. md.
Ca. 78,750 DKK pr md
Område
Randers C, Randers
Type
Office space
Office space in Dublin 18, Dublin
 More info
Office space in Dublin 18, Dublin
Office space for rent in Dublin 18, Dublin
Areal
Ca. 10 m2
Pris pr. md.
Ca. 850 EUR pr md
Område
Dublin 18, Dublin
Type
Office space
Office space in Stad Antwerp, Antwerp
 More info
Office space in Stad Antwerp, Antwerp
Office space for rent in Stad Antwerp, Antwerp
Areal
360 - 3,310 m2
Pris pr. md.
Ca. 17,950 EUR pr md
Område
Stad Antwerp, Antwerp
Type
Office space
Office space in Zaanstad, North Holland
 More info
Office space in Zaanstad, North Holland
Office space for rent in Zaanstad, North Holland
Areal
Ca. 110 m2
Pris pr. md.
Ca. 1,550 EUR pr md
Område
Zaanstad, North Holland
Type
Office space
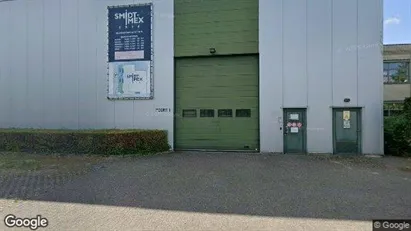
Commercial space in Enschede, Overijssel
 More info
Commercial space in Enschede, Overijssel
Te huur bedrijfsruimte met kantoor aan de Richtersweg te Enschede
Objectomschrijving:
Aan de Richtersweg in Enschede wordt deze representatieve bedrij...
Areal
Ca. 3,330 m2
Pris pr. md.
Ca. 4,150 EUR pr md
Område
Enschede, Overijssel
Type
Commercial property
Office space in Leeuwarden, Friesland NL
 More info
Office space in Leeuwarden, Friesland NL
Office space for rent in Leeuwarden, Friesland NL
Areal
Ca. 145 m2
Pris pr. md.
Ca. 1,050 EUR pr md
Område
Leeuwarden, Friesland NL
Type
Office space
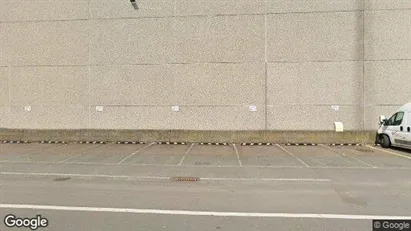
Warehouse in Videbæk, Central Jutland Region
 More info
Warehouse in Videbæk, Central Jutland Region
Warehouse for rent in Videbæk, Central Jutland Region
Areal
Ca. 830 m2
Pris pr. md.
Ca. 12,000 DKK pr md
Område
Videbæk, Central Jutland Region
Type
Warehouse
Selected customers
30,000 customers use Companyspace.com
30,000 customers
285,000 companies in our database
2,400 rentals annually
Companyspace.com is used by thousands of landlords, property companies, commercial real estate agents, investors and business centres seeking greater visibility, more enquiries and lower vacancy rates.


