


Commercial premises for rent in Europe
There are 284,856 available commercial properties in Europe right now. Companyspace.com collects commercial properties from many different parts of the market, so that you as a company can more easily get an overview of available commercial properties in Europe.
Companyspace.com today:
New today 61
Updated 24h 1,610
Notifications about new companyspaces1,885
Copenhagen +4
Stockholm +2
Vienna +15
Roma (region) +1
Latest update 1 h ago
Active ads 371,259
284,856 company spaces found
Office space in Tiel, Gelderland
 More info
Office space in Tiel, Gelderland
Office space for rent in Tiel, Gelderland
Areal
Ca. 110 m2
Pris pr. md.
Ca. 2,450 EUR pr md
Område
Tiel, Gelderland
Type
Office space
Office space in Eindhoven, North Brabant
 More info
Office space in Eindhoven, North Brabant
Office space for rent in Eindhoven, North Brabant
Areal
Ca. 150 m2
Pris pr. md.
Ca. 1,750 EUR pr md
Område
Eindhoven, North Brabant
Type
Office space
Commercial space in Norrköping, Östergötland County
 More info
Commercial space in Norrköping, Östergötland County
Commercial space for rent in Norrköping, Östergötland County
Areal
Ca. 75 m2
Pris pr. md.
Ca. 7,400 SEK pr md
Område
Norrköping, Östergötland County
Type
Commercial property
Warehouse in Padborg, Region of Southern Denmark
 More info
Warehouse in Padborg, Region of Southern Denmark
Warehouse for rent in Padborg, Region of Southern Denmark
Areal
Ca. 5,005 m2
Pris pr. md.
Ca. 110,000 DKK pr md
Område
Padborg, Region of Southern Denmark
Type
Warehouse
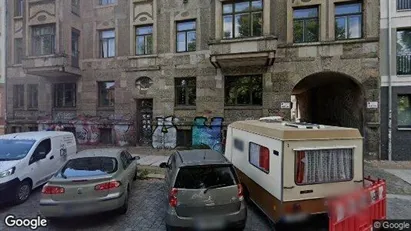
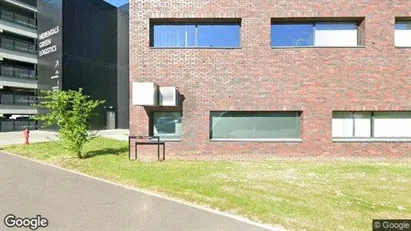
Office space in Leipzig, Sachsen
 More info
Office space in Leipzig, Sachsen
Office space for rent in Leipzig, Sachsen
Areal
Ca. 500 m2
Pris pr. md.
Not stated
Område
Leipzig, Sachsen
Type
Office space
Office space in Werkendam, North Brabant
 More info
Office space in Werkendam, North Brabant
Office space for rent in Werkendam, North Brabant
Areal
-
Pris pr. md.
Ca. 1,500 EUR pr md
Område
Werkendam, North Brabant
Type
Office space
Office space in Amsterdam Oost-Watergraafsmeer, Amsterdam
 More info
Office space in Amsterdam Oost-Watergraafsmeer, Amsterdam
Office space for rent in Amsterdam Oost-Watergraafsmeer, Amsterdam
Areal
Ca. 75 m2
Pris pr. md.
Ca. 1,950 EUR pr md
Område
Amsterdam Oost-Watergraafsmeer, Amsterdam
Type
Office space
Office space in Herentals, Antwerp (Province)
 More info
Office space in Herentals, Antwerp (Province)
Office space for rent in Herentals, Antwerp (Province)
Areal
Ca. 5 m2
Pris pr. md.
Ca. 300 EUR pr md
Område
Herentals, Antwerp (Province)
Type
Office space
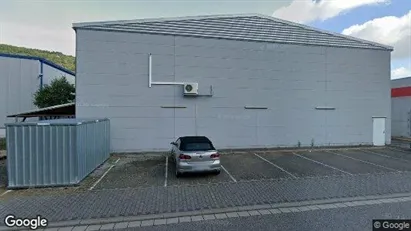
Commercial space in Birkenfeld, Baden-Württemberg
 More info
Commercial space in Birkenfeld, Baden-Württemberg
Commercial space for rent in Birkenfeld, Baden-Württemberg
Areal
Ca. 615 m2
Pris pr. md.
Not stated
Område
Birkenfeld, Baden-Württemberg
Type
Commercial property
Commercial space in Turku, Varsinais-Suomi
 More info
Commercial space in Turku, Varsinais-Suomi
Commercial space for rent in Turku, Varsinais-Suomi
Areal
Ca. 240 m2
Pris pr. md.
Not stated
Område
Turku, Varsinais-Suomi
Type
Commercial property
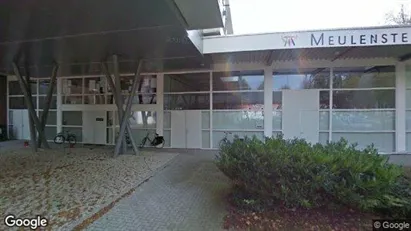
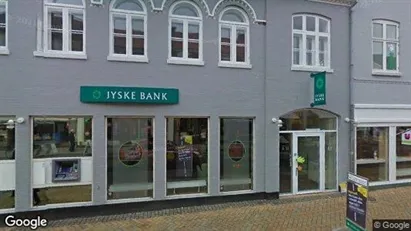
Office space in Middelfart, Funen
 More info
Office space in Middelfart, Funen
Office space for rent in Middelfart, Funen
Areal
Ca. 220 m2
Pris pr. md.
Ca. 11,000 DKK pr md
Område
Middelfart, Funen
Type
Office space
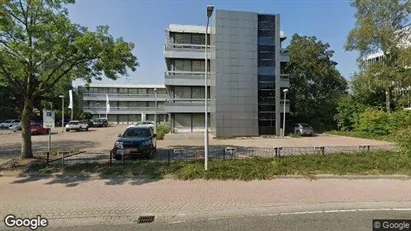
Office space in Apeldoorn, Gelderland
 More info
Office space in Apeldoorn, Gelderland
Office space for rent in Apeldoorn, Gelderland
Areal
Ca. 10 m2
Pris pr. md.
Ca. 100 EUR pr md
Område
Apeldoorn, Gelderland
Type
Office space
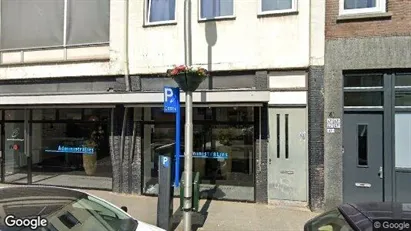
Office space in Tilburg, North Brabant
 More info
Office space in Tilburg, North Brabant
Office space for rent in Tilburg, North Brabant
Areal
Ca. 235 m2
Pris pr. md.
Ca. 2,200 EUR pr md
Område
Tilburg, North Brabant
Type
Office space
Office space in Bladel, North Brabant
 More info
Office space in Bladel, North Brabant
Office space for rent in Bladel, North Brabant
Areal
Ca. 145 m2
Pris pr. md.
Ca. 1,200 EUR pr md
Område
Bladel, North Brabant
Type
Office space
Commercial space in Houten, Province of Utrecht
 More info
Commercial space in Houten, Province of Utrecht
Commercial space for rent in Houten, Province of Utrecht
Areal
Ca. 35 m2
Pris pr. md.
Ca. 1,000 EUR pr md
Område
Houten, Province of Utrecht
Type
Commercial property
Office space in Leipzig, Sachsen
 More info
Office space in Leipzig, Sachsen
Office space for rent in Leipzig, Sachsen
Areal
Ca. 915 m2
Pris pr. md.
Not stated
Område
Leipzig, Sachsen
Type
Office space
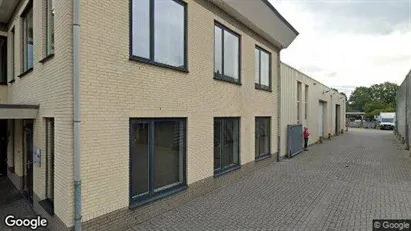
Industrial property in Bladel, North Brabant
 More info
Industrial property in Bladel, North Brabant
Industrial property for rent in Bladel, North Brabant
Areal
Ca. 130 m2
Pris pr. md.
Ca. 1,150 EUR pr md
Område
Bladel, North Brabant
Type
Industrial property
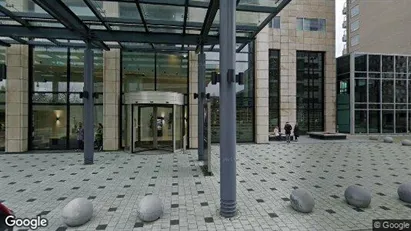
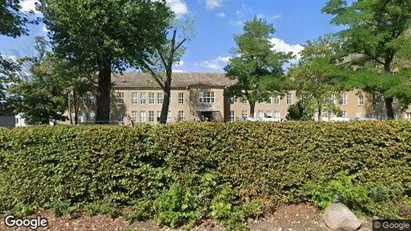
Office space in Utrecht Zuid-West, Utrecht
 More info
Office space in Utrecht Zuid-West, Utrecht
Office space for rent in Utrecht Zuid-West, Utrecht
Areal
Ca. 200 m2
Pris pr. md.
Ca. 2,950 EUR pr md
Område
Utrecht Zuid-West, Utrecht
Type
Office space
Selected customers
30,000 customers use Companyspace.com
30,000 customers
285,000 companies in our database
2,400 rentals annually
Companyspace.com is used by thousands of landlords, property companies, commercial real estate agents, investors and business centres seeking greater visibility, more enquiries and lower vacancy rates.


