


Commercial premises for rent in Europe
There are 284,065 available commercial properties in Europe right now. Companyspace.com collects commercial properties from many different parts of the market, so that you as a company can more easily get an overview of available commercial properties in Europe.
Companyspace.com today:
New today 2,965
Updated 24h 3,141
Notifications about new companyspaces2,183
Copenhagen +6
Stockholm +10
Amsterdam +3
Berlin +3
Vienna +6
Paris +5
Madrid +4
Dublin (county) +23
Warsaw +19
Greater London +14
Latest update 1 h ago
Active ads 369,199
284,065 company spaces found
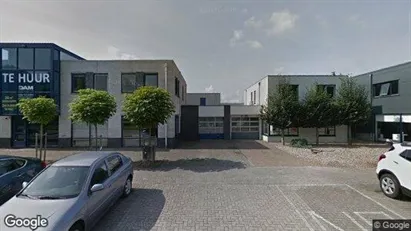
Office space in Enschede, Overijssel
 More info
Office space in Enschede, Overijssel
Kantoor te huur in Enschede, Overijssel
Areal
100 - 1,500 m2
Pris pr. md.
Not stated
Område
Enschede, Overijssel
Type
Office space
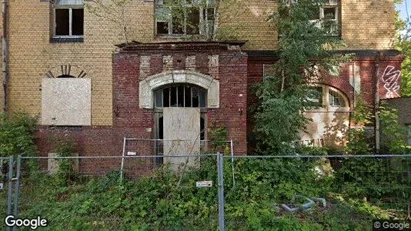
Office space in Leipzig, Sachsen
 More info
Office space in Leipzig, Sachsen
Office space for rent in Leipzig, Sachsen
Areal
Ca. 1,425 m2
Pris pr. md.
Not stated
Område
Leipzig, Sachsen
Type
Office space
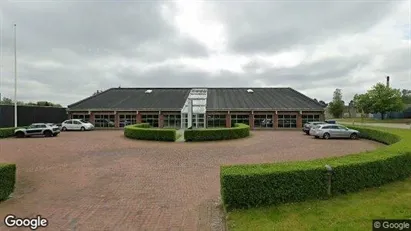
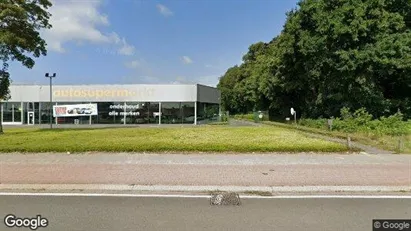
Commercial space in Zaanstad, North Holland
 More info
Commercial space in Zaanstad, North Holland
Commercial space for rent in Zaanstad, North Holland
Areal
-
Pris pr. md.
Ca. 5,000 EUR pr md
Område
Zaanstad, North Holland
Type
Commercial property
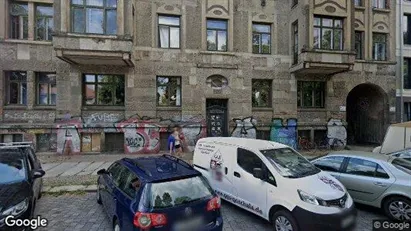
Office space in Berlin Charlottenburg-Wilmersdorf, Berlin
 More info
Office space in Berlin Charlottenburg-Wilmersdorf, Berlin
Office space for rent in Berlin Charlottenburg-Wilmersdorf, Berlin
Areal
Ca. 20,705 m2
Pris pr. md.
Not stated
Område
Berlin Charlottenburg-Wilmersdorf, Berlin
Type
Office space
Commercial space in Oulu, Pohjois-Pohjanmaa
 More info
Commercial space in Oulu, Pohjois-Pohjanmaa
Commercial space for rent in Oulu, Pohjois-Pohjanmaa
Areal
Ca. 1,200 m2
Pris pr. md.
Ca. 6,400 EUR pr md
Område
Oulu, Pohjois-Pohjanmaa
Type
Commercial property
Office space in Leipzig, Sachsen
 More info
Office space in Leipzig, Sachsen
Office space for rent in Leipzig, Sachsen
Areal
Ca. 3,400 m2
Pris pr. md.
Not stated
Område
Leipzig, Sachsen
Type
Office space
Commercial space in Zeewolde, Flevoland
 More info
Commercial space in Zeewolde, Flevoland
Commercial space for rent in Zeewolde, Flevoland
Areal
Ca. 150 m2
Pris pr. md.
Ca. 1,400 EUR pr md
Område
Zeewolde, Flevoland
Type
Commercial property
Office space in Esbjerg, Esbjerg (region)
 More info
Office space in Esbjerg, Esbjerg (region)
Office space for rent in Esbjerg, Esbjerg (region)
Areal
Ca. 45 m2
Pris pr. md.
Ca. 3,500 DKK pr md
Område
Esbjerg, Esbjerg (region)
Type
Office space
Office space in Herning, Central Jutland Region
 More info
Office space in Herning, Central Jutland Region
Office space for rent in Herning, Central Jutland Region
Areal
Ca. 960 m2
Pris pr. md.
Ca. 43,500 DKK pr md
Område
Herning, Central Jutland Region
Type
Office space
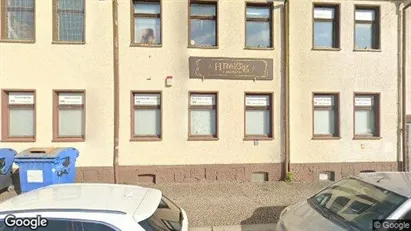
Office space in Antwerp Wilrijk, Antwerp
 More info
Office space in Antwerp Wilrijk, Antwerp
Office space for rent in Antwerp Wilrijk, Antwerp
Areal
Ca. 35 m2
Pris pr. md.
Ca. 500 EUR pr md
Område
Antwerp Wilrijk, Antwerp
Type
Office space
Industrial property in Dublin 6, Dublin
 More info
Industrial property in Dublin 6, Dublin
Industrial property for rent in Dublin 6, Dublin
Areal
Ca. 15 m2
Pris pr. md.
Ca. 450 EUR pr md
Område
Dublin 6, Dublin
Type
Industrial property
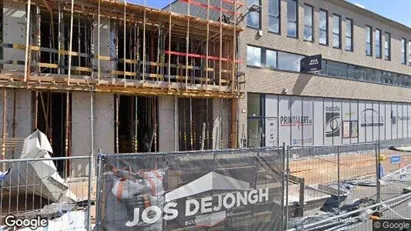
Commercial space in De Ronde Venen, Province of Utrecht
 More info
Commercial space in De Ronde Venen, Province of Utrecht
Commercial space for rent in De Ronde Venen, Province of Utrecht
Areal
Ca. 180 m2
Pris pr. md.
Ca. 1,900 EUR pr md
Område
De Ronde Venen, Province of Utrecht
Type
Commercial property
Warehouse in Ribe, Region of Southern Denmark
 More info
Warehouse in Ribe, Region of Southern Denmark
Warehouse for rent in Ribe, Region of Southern Denmark
Areal
Ca. 6,345 m2
Pris pr. md.
Ca. 155,450 DKK pr md
Område
Ribe, Region of Southern Denmark
Type
Warehouse
Office space in Stad Antwerp, Antwerp
 More info
Office space in Stad Antwerp, Antwerp
Office space for rent in Stad Antwerp, Antwerp
Areal
Ca. 110 m2
Pris pr. md.
Ca. 1,000 EUR pr md
Område
Stad Antwerp, Antwerp
Type
Office space
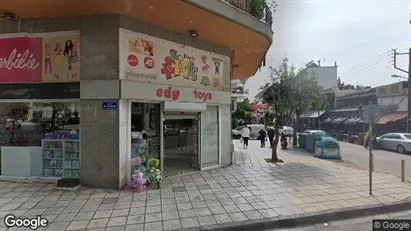
Commercial space in Ampelokipoi-Menemeni, Central Macedonia
 More info
Commercial space in Ampelokipoi-Menemeni, Central Macedonia
Commercial space for rent in Ampelokipoi-Menemeni, Central Macedonia
Areal
Ca. 100 m2
Pris pr. md.
Ca. 750 EUR pr md
Område
Ampelokipoi-Menemeni, Central Macedonia
Type
Commercial property
Office space in Leipzig, Sachsen
 More info
Office space in Leipzig, Sachsen
Office space for rent in Leipzig, Sachsen
Areal
Ca. 1,745 m2
Pris pr. md.
Not stated
Område
Leipzig, Sachsen
Type
Office space
Office space in Nijmegen, Gelderland
 More info
Office space in Nijmegen, Gelderland
Office space for rent in Nijmegen, Gelderland
Areal
-
Pris pr. md.
Ca. 1,300 EUR pr md
Område
Nijmegen, Gelderland
Type
Office space
Garage in Vorpommern-Rügen, Mecklenburg-Vorpommern
 More info
Garage in Vorpommern-Rügen, Mecklenburg-Vorpommern
Garage for rent in Vorpommern-Rügen, Mecklenburg-Vorpommern
Areal
-
Pris pr. md.
Not stated
Område
Vorpommern-Rügen, Mecklenburg-Vorpommern
Type
Garage
Selected customers
30,000 customers use Companyspace.com
30,000 customers
285,000 companies in our database
2,400 rentals annually
Companyspace.com is used by thousands of landlords, property companies, commercial real estate agents, investors and business centres seeking greater visibility, more enquiries and lower vacancy rates.


