


Commercial premises for rent in Europe
There are 284,065 available commercial properties in Europe right now. Companyspace.com collects commercial properties from many different parts of the market, so that you as a company can more easily get an overview of available commercial properties in Europe.
Companyspace.com today:
New today 2,965
Updated 24h 3,346
Notifications about new companyspaces2,183
Copenhagen +6
Stockholm +10
Amsterdam +3
Berlin +3
Vienna +6
Paris +5
Madrid +4
Dublin (county) +23
Warsaw +19
Greater London +14
Latest update 41 min ago
Active ads 369,199
284,065 company spaces found
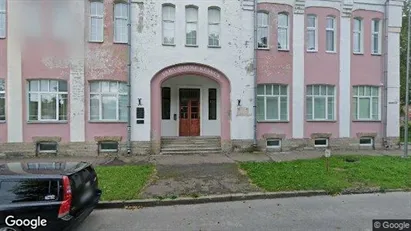
Office space in Põhja-Tallinn, Tallinn
 More info
Office space in Põhja-Tallinn, Tallinn
Office space for rent in Põhja-Tallinn, Tallinn
Areal
Ca. 125 m2
Pris pr. md.
Ca. 650 EUR pr md
Område
Põhja-Tallinn, Tallinn
Type
Office space
Office space in Frederiksberg C, Copenhagen
 More info
Office space in Frederiksberg C, Copenhagen
Office space for rent in Frederiksberg C, Copenhagen
Areal
Ca. 25 m2
Pris pr. md.
Ca. 9,150 DKK pr md
Område
Frederiksberg C, Copenhagen
Type
Office space
Commercial space in Oulu, Pohjois-Pohjanmaa
 More info
Commercial space in Oulu, Pohjois-Pohjanmaa
Commercial space for rent in Oulu, Pohjois-Pohjanmaa
Areal
Ca. 145 m2
Pris pr. md.
Not stated
Område
Oulu, Pohjois-Pohjanmaa
Type
Commercial property
Office space in Zoetermeer, South Holland
 More info
Office space in Zoetermeer, South Holland
Office space for rent in Zoetermeer, South Holland
Areal
Ca. 15 m2
Pris pr. md.
Ca. 800 EUR pr md
Område
Zoetermeer, South Holland
Type
Office space
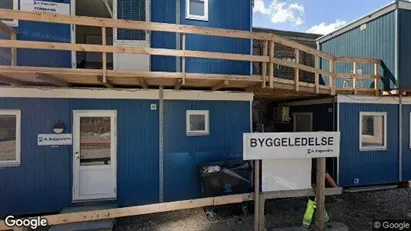
Office space in Herning, Central Jutland Region
 More info
Office space in Herning, Central Jutland Region
Office space for rent in Herning, Central Jutland Region
Areal
Ca. 150 m2
Pris pr. md.
Ca. 3,900 DKK pr md
Område
Herning, Central Jutland Region
Type
Office space
Office space in Copenhagen SV, Copenhagen
 More info
Office space in Copenhagen SV, Copenhagen
Office space for rent in Copenhagen SV, Copenhagen
Areal
Ca. 1,185 m2
Pris pr. md.
Not stated
Område
Copenhagen SV, Copenhagen
Type
Office space
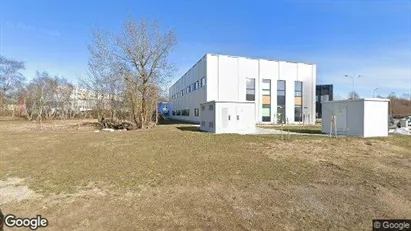
Office space in Zürich Distrikt 8, Zürich
 More info
Office space in Zürich Distrikt 8, Zürich
Office space for rent in Zürich Distrikt 8, Zürich
Areal
Ca. 500 m2
Pris pr. md.
Not stated
Område
Zürich Distrikt 8, Zürich
Type
Office space
Commercial space in Dordrecht, South Holland
 More info
Commercial space in Dordrecht, South Holland
Commercial space for rent in Dordrecht, South Holland
Areal
Ca. 2,090 m2
Pris pr. md.
Not stated
Område
Dordrecht, South Holland
Type
Commercial property
Commercial space in Patras, Western Greece
 More info
Commercial space in Patras, Western Greece
Commercial space for rent in Patras, Western Greece
Areal
Ca. 30 m2
Pris pr. md.
Ca. 500 EUR pr md
Område
Patras, Western Greece
Type
Commercial property
Office space in Esbjerg, Esbjerg (region)
More info
Office space in Esbjerg, Esbjerg (region)
Office space for rent in Esbjerg, Esbjerg (region)
Areal
Ca. 180 m2
Pris pr. md.
Ca. 8,500 DKK pr md
Område
Esbjerg, Esbjerg (region)
Type
Office space
Office space in Tallinn Kesklinna, Tallinn
 More info
Office space in Tallinn Kesklinna, Tallinn
Office space for rent in Tallinn Kesklinna, Tallinn
Areal
Ca. 1,090 m2
Pris pr. md.
Ca. 8,200 EUR pr md
Område
Tallinn Kesklinna, Tallinn
Type
Office space
Office space in Narva, Ida-Viru
 More info
Office space in Narva, Ida-Viru
Office space for rent in Narva, Ida-Viru
Areal
Ca. 50 m2
Pris pr. md.
Ca. 200 EUR pr md
Område
Narva, Ida-Viru
Type
Office space
Office space in Zoetermeer, South Holland
 More info
Office space in Zoetermeer, South Holland
Office space for rent in Zoetermeer, South Holland
Areal
Ca. 110 m2
Pris pr. md.
Ca. 2,150 EUR pr md
Område
Zoetermeer, South Holland
Type
Office space
Office space in Aarhus C, Aarhus
 More info
Office space in Aarhus C, Aarhus
Office space for rent in Aarhus C, Aarhus
Areal
Ca. 260 m2
Pris pr. md.
Ca. 31,200 DKK pr md
Område
Aarhus C, Aarhus
Type
Office space
Office space in Maardu, Harju
 More info
Office space in Maardu, Harju
Office space for rent in Maardu, Harju
Areal
-
Pris pr. md.
Ca. 400 EUR pr md
Område
Maardu, Harju
Type
Office space
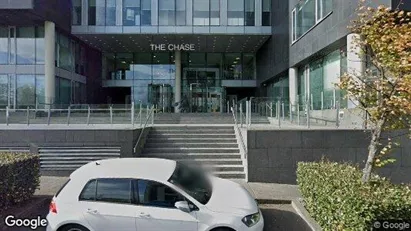
Office space in Dublin 18, Dublin
 More info
Office space in Dublin 18, Dublin
Office space for rent in Dublin 18, Dublin
Areal
Ca. 45 m2
Pris pr. md.
Ca. 4,400 EUR pr md
Område
Dublin 18, Dublin
Type
Office space
Industrial property in Riihimäki, Kanta-Häme
 More info
Industrial property in Riihimäki, Kanta-Häme
Industrial property for rent in Riihimäki, Kanta-Häme
Areal
Ca. 80 m2
Pris pr. md.
Ca. 600 EUR pr md
Område
Riihimäki, Kanta-Häme
Type
Industrial property
Office space in Zoetermeer, South Holland
 More info
Office space in Zoetermeer, South Holland
Office space for rent in Zoetermeer, South Holland
Areal
Ca. 75 m2
Pris pr. md.
Ca. 1,050 EUR pr md
Område
Zoetermeer, South Holland
Type
Office space
Selected customers
30,000 customers use Companyspace.com
30,000 customers
285,000 companies in our database
2,400 rentals annually
Companyspace.com is used by thousands of landlords, property companies, commercial real estate agents, investors and business centres seeking greater visibility, more enquiries and lower vacancy rates.


