


Commercial premises for rent in Europe
There are 284,076 available commercial properties in Europe right now. Companyspace.com collects commercial properties from many different parts of the market, so that you as a company can more easily get an overview of available commercial properties in Europe.
Companyspace.com today:
New today 2,918
Updated 24h 3,932
Notifications about new companyspaces2,169
Copenhagen +4
Stockholm +1
Amsterdam +3
Berlin +3
Vienna +6
Paris +5
Madrid +4
Dublin (county) +23
Warsaw +19
Greater London +14
Latest update 5 min ago
Active ads 369,215
284,076 company spaces found
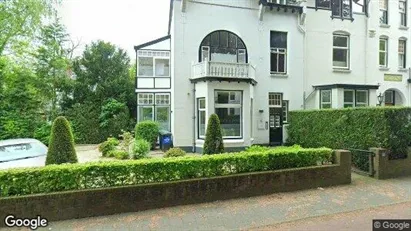
Office space in Hilversum, North Holland
 More info
Office space in Hilversum, North Holland
Office space for rent in Hilversum, North Holland
Areal
Ca. 110 m2
Pris pr. md.
Ca. 1,900 EUR pr md
Område
Hilversum, North Holland
Type
Office space
Office space in Venlo, Limburg
 More info
Office space in Venlo, Limburg
Office space for rent in Venlo, Limburg
Areal
Ca. 45 m2
Pris pr. md.
Ca. 1,300 EUR pr md
Område
Venlo, Limburg
Type
Office space
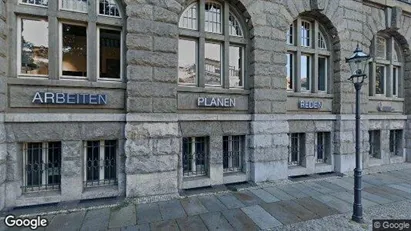
Office space in Leipzig, Sachsen
 More info
Office space in Leipzig, Sachsen
Office space for rent in Leipzig, Sachsen
Areal
Ca. 520 m2
Pris pr. md.
Not stated
Område
Leipzig, Sachsen
Type
Office space
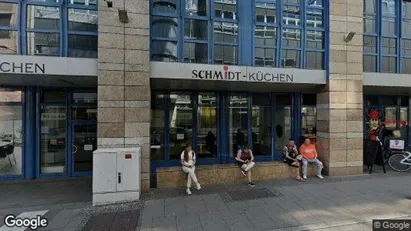
Office space in Leipzig, Sachsen
 More info
Office space in Leipzig, Sachsen
Office space for rent in Leipzig, Sachsen
Areal
Ca. 280 m2
Pris pr. md.
Not stated
Område
Leipzig, Sachsen
Type
Office space
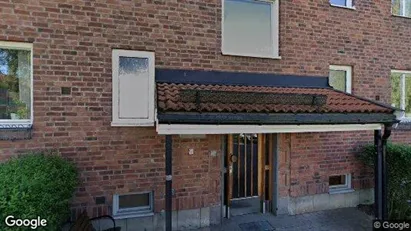
Commercial space in Norrköping, Östergötland County
 More info
Commercial space in Norrköping, Östergötland County
Commercial space for rent in Norrköping, Östergötland County
Areal
Ca. 60 m2
Pris pr. md.
Ca. 7,000 SEK pr md
Område
Norrköping, Östergötland County
Type
Commercial property
Office space in Copenhagen S, Copenhagen
 More info
Office space in Copenhagen S, Copenhagen
Office space for rent in Copenhagen S, Copenhagen
Areal
Ca. 590 m2
Pris pr. md.
Not stated
Område
Copenhagen S, Copenhagen
Type
Office space
Office space in Leipzig, Sachsen
 More info
Office space in Leipzig, Sachsen
Office space for rent in Leipzig, Sachsen
Areal
Ca. 20 m2
Pris pr. md.
Ca. 850 EUR pr md
Område
Leipzig, Sachsen
Type
Office space
Office space in Leipzig, Sachsen
 More info
Office space in Leipzig, Sachsen
Office space for rent in Leipzig, Sachsen
Areal
Ca. 305 m2
Pris pr. md.
Not stated
Område
Leipzig, Sachsen
Type
Office space
Industrial property in Nijkerk, Gelderland
 More info
Industrial property in Nijkerk, Gelderland
Productie te huur in Nijkerk, Gelderland
Areal
Ca. 60 m2
Pris pr. md.
Ca. 1,650 EUR pr md
Område
Nijkerk, Gelderland
Type
Industrial property
Warehouse in Hornsyld, Central Jutland Region
 More info
Warehouse in Hornsyld, Central Jutland Region
Warehouse for rent in Hornsyld, Central Jutland Region
Areal
Ca. 5,850 m2
Pris pr. md.
Ca. 149,100 DKK pr md
Område
Hornsyld, Central Jutland Region
Type
Warehouse
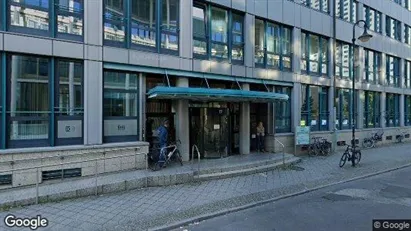
Office space in Copenhagen K, Copenhagen
More info
Office space in Copenhagen K, Copenhagen
Office space for rent in Copenhagen K, Copenhagen
Areal
Ca. 625 m2
Pris pr. md.
Ca. 74,250 DKK pr md
Område
Copenhagen K, Copenhagen
Type
Office space
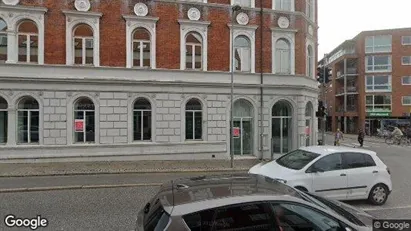
Office space in Horsens, Central Jutland Region
 More info
Office space in Horsens, Central Jutland Region
Office space for rent in Horsens, Central Jutland Region
Areal
Ca. 210 m2
Pris pr. md.
Ca. 12,200 DKK pr md
Område
Horsens, Central Jutland Region
Type
Office space
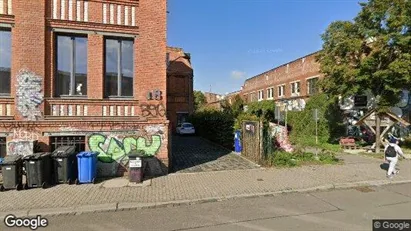
Office space in Leipzig, Sachsen
 More info
Office space in Leipzig, Sachsen
Office space for rent in Leipzig, Sachsen
Areal
Ca. 30 m2
Pris pr. md.
Not stated
Område
Leipzig, Sachsen
Type
Office space
Commercial space in Norrköping, Östergötland County
More info
Commercial space in Norrköping, Östergötland County
Commercial space for rent in Norrköping, Östergötland County
Areal
Ca. 95 m2
Pris pr. md.
Ca. 9,600 SEK pr md
Område
Norrköping, Östergötland County
Type
Commercial property
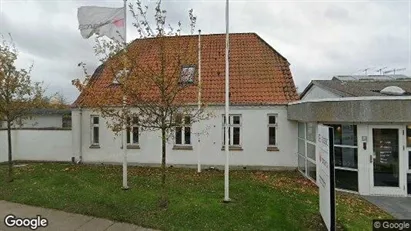
Office space in Them, Central Jutland Region
 More info
Office space in Them, Central Jutland Region
Office space for rent in Them, Central Jutland Region
Areal
Ca. 1,175 m2
Pris pr. md.
Ca. 38,700 DKK pr md
Område
Them, Central Jutland Region
Type
Office space
Industrial property in Noordoostpolder, Flevoland
 More info
Industrial property in Noordoostpolder, Flevoland
Industrial property for rent in Noordoostpolder, Flevoland
Areal
Ca. 325 m2
Pris pr. md.
Ca. 2,900 EUR pr md
Område
Noordoostpolder, Flevoland
Type
Industrial property
Office space in Leipzig, Sachsen
 More info
Office space in Leipzig, Sachsen
Office space for rent in Leipzig, Sachsen
Areal
Ca. 210 m2
Pris pr. md.
Not stated
Område
Leipzig, Sachsen
Type
Office space
Office space in Leipzig, Sachsen
 More info
Office space in Leipzig, Sachsen
Office space for rent in Leipzig, Sachsen
Areal
Ca. 950 m2
Pris pr. md.
Not stated
Område
Leipzig, Sachsen
Type
Office space
Selected customers
30,000 customers use Companyspace.com
30,000 customers
285,000 companies in our database
2,400 rentals annually
Companyspace.com is used by thousands of landlords, property companies, commercial real estate agents, investors and business centres seeking greater visibility, more enquiries and lower vacancy rates.


