


Commercial premises for rent in Europe
There are 281,922 available commercial properties in Europe right now. Companyspace.com collects commercial properties from many different parts of the market, so that you as a company can more easily get an overview of available commercial properties in Europe.
Companyspace.com today:
New today 477
Updated 24h 1,507
Notifications about new companyspaces44
Copenhagen +2
Amsterdam +12
Vienna +1
Paris +5
Dublin (county) +48
Warsaw +12
Greater London +6
Latest update 15 min ago
Active ads 369,076
281,922 company spaces found
Warehouse in Grimbergen, Vlaams-Brabant
 More info
Warehouse in Grimbergen, Vlaams-Brabant
Warehouse for rent in Grimbergen, Vlaams-Brabant
Areal
Ca. 4,850 m2
Pris pr. md.
Ca. 26,250 EUR pr md
Område
Grimbergen, Vlaams-Brabant
Type
Warehouse
Commercial space in Zaventem, Vlaams-Brabant
 More info
Commercial space in Zaventem, Vlaams-Brabant
Commercial space for rent in Zaventem, Vlaams-Brabant
Areal
Ca. 1,765 m2
Pris pr. md.
Ca. 10,300 EUR pr md
Område
Zaventem, Vlaams-Brabant
Type
Commercial property
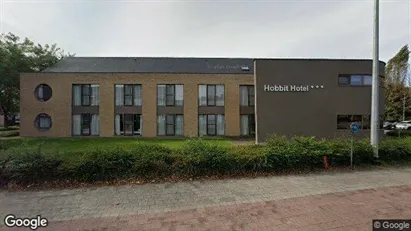
Office space in Haarlemmermeer, North Holland
 More info
Office space in Haarlemmermeer, North Holland
Office space for rent in Haarlemmermeer, North Holland
Areal
Ca. 10 m2
Pris pr. md.
Ca. 150 EUR pr md
Område
Haarlemmermeer, North Holland
Type
Office space
Office space in Meierijstad, North Brabant
 More info
Office space in Meierijstad, North Brabant
Office space for rent in Meierijstad, North Brabant
Areal
Ca. 105 m2
Pris pr. md.
Ca. 1,150 EUR pr md
Område
Meierijstad, North Brabant
Type
Office space
Office space in Utrecht West, Utrecht
 More info
Office space in Utrecht West, Utrecht
Office space for rent in Utrecht West, Utrecht
Areal
Ca. 30 m2
Pris pr. md.
Ca. 750 EUR pr md
Område
Utrecht West, Utrecht
Type
Office space
Office space in Utrecht Oost, Utrecht
 More info
Office space in Utrecht Oost, Utrecht
Office space for rent in Utrecht Oost, Utrecht
Areal
Ca. 75 m2
Pris pr. md.
Ca. 950 EUR pr md
Område
Utrecht Oost, Utrecht
Type
Office space
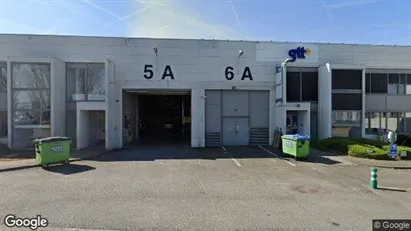
Warehouse in Mechelen, Antwerp (Province)
 More info
Warehouse in Mechelen, Antwerp (Province)
Warehouse for rent in Mechelen, Antwerp (Province)
Areal
Ca. 4,605 m2
Pris pr. md.
Ca. 26,850 EUR pr md
Område
Mechelen, Antwerp (Province)
Type
Warehouse
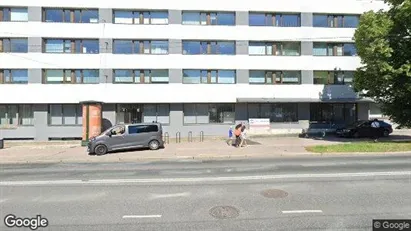
Office space in Tallinn Kesklinna, Tallinn
 More info
Office space in Tallinn Kesklinna, Tallinn
Office space for rent in Tallinn Kesklinna, Tallinn
Areal
-
Pris pr. md.
Ca. 1,243,000 EUR pr md
Område
Tallinn Kesklinna, Tallinn
Type
Office space
Office space in Turku, Varsinais-Suomi
 More info
Office space in Turku, Varsinais-Suomi
Office space for rent in Turku, Varsinais-Suomi
Areal
-
Pris pr. md.
Not stated
Område
Turku, Varsinais-Suomi
Type
Office space
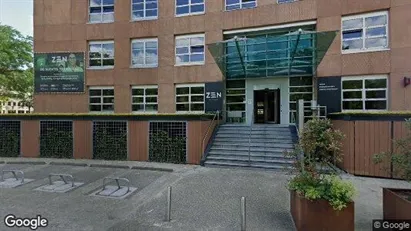
Office space in Mechelen, Antwerp (Province)
 More info
Office space in Mechelen, Antwerp (Province)
Office space for rent in Mechelen, Antwerp (Province)
Areal
Ca. 360 m2
Pris pr. md.
Ca. 3,450 EUR pr md
Område
Mechelen, Antwerp (Province)
Type
Office space
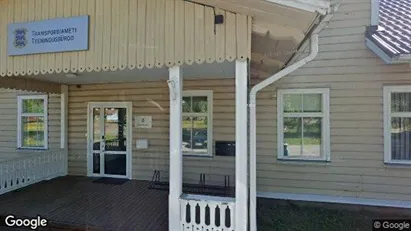
Office space in Jõgeva, Jõgeva (region)
 More info
Office space in Jõgeva, Jõgeva (region)
Office space for rent in Jõgeva, Jõgeva (region)
Areal
-
Pris pr. md.
Ca. 400 EUR pr md
Område
Jõgeva, Jõgeva (region)
Type
Office space
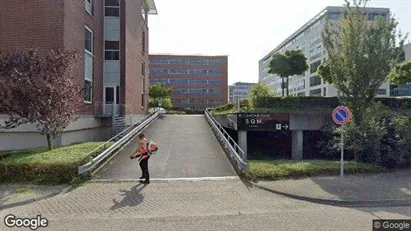
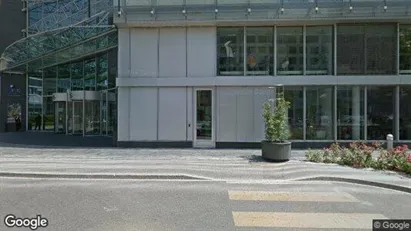
Office space in Vernier, Geneva (Kantone)
 More info
Office space in Vernier, Geneva (Kantone)
Office space for rent in Vernier, Geneva (Kantone)
Areal
Ca. 2,660 m2
Pris pr. md.
Not stated
Område
Vernier, Geneva (Kantone)
Type
Office space
Office space in Tallinn Kesklinna, Tallinn
 More info
Office space in Tallinn Kesklinna, Tallinn
Office space for rent in Tallinn Kesklinna, Tallinn
Areal
Ca. 20 m2
Pris pr. md.
Ca. 150 EUR pr md
Område
Tallinn Kesklinna, Tallinn
Type
Office space
Office space in Tallinn Kesklinna, Tallinn
 More info
Office space in Tallinn Kesklinna, Tallinn
Office space for rent in Tallinn Kesklinna, Tallinn
Areal
-
Pris pr. md.
Ca. 1,100 EUR pr md
Område
Tallinn Kesklinna, Tallinn
Type
Office space
Office space in Tartu, Tartu (region)
 More info
Office space in Tartu, Tartu (region)
Office space for rent in Tartu, Tartu (region)
Areal
-
Pris pr. md.
Ca. 1,150 EUR pr md
Område
Tartu, Tartu (region)
Type
Office space
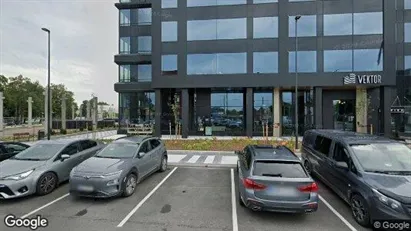
Office space in Waalre, North Brabant
 More info
Office space in Waalre, North Brabant
Office space for rent in Waalre, North Brabant
Areal
Ca. 30 m2
Pris pr. md.
Not stated
Område
Waalre, North Brabant
Type
Office space
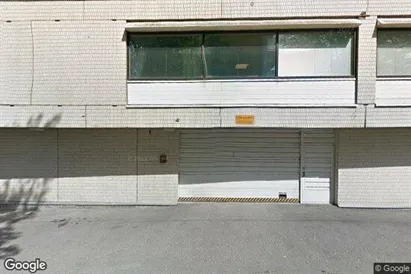
Commercial space in Grimbergen, Vlaams-Brabant
 More info
Commercial space in Grimbergen, Vlaams-Brabant
Commercial space for rent in Grimbergen, Vlaams-Brabant
Areal
Ca. 7,600 m2
Pris pr. md.
Ca. 42,300 EUR pr md
Område
Grimbergen, Vlaams-Brabant
Type
Commercial property
Office space in Utrecht Oost, Utrecht
 More info
Office space in Utrecht Oost, Utrecht
Office space for rent in Utrecht Oost, Utrecht
Areal
Ca. 10 m2
Pris pr. md.
Ca. 250 EUR pr md
Område
Utrecht Oost, Utrecht
Type
Office space
Selected customers
30,000 customers use Companyspace.com
30,000 customers
285,000 companies in our database
2,400 rentals annually
Companyspace.com is used by thousands of landlords, property companies, commercial real estate agents, investors and business centres seeking greater visibility, more enquiries and lower vacancy rates.


