


Commercial premises for rent in Europe
There are 281,960 available commercial properties in Europe right now. Companyspace.com collects commercial properties from many different parts of the market, so that you as a company can more easily get an overview of available commercial properties in Europe.
Companyspace.com today:
New today 515
Updated 24h 1,524
Notifications about new companyspaces1,781
Copenhagen +2
Amsterdam +12
Vienna +15
Paris +5
Dublin (county) +48
Warsaw +12
Greater London +6
Latest update 58 min ago
Active ads 369,103
281,960 company spaces found
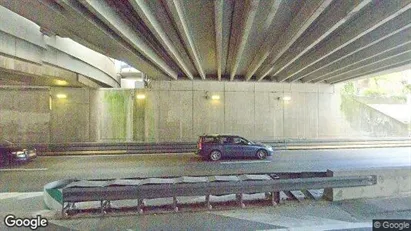
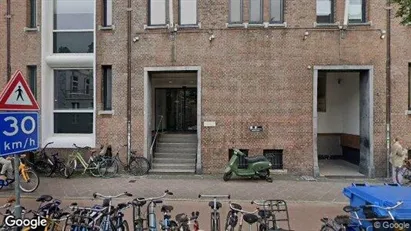
Office space in The Hague Haagse Hout, The Hague
 More info
Office space in The Hague Haagse Hout, The Hague
Office space for rent in The Hague Haagse Hout, The Hague
Areal
Ca. 75 m2
Pris pr. md.
Ca. 1,600 EUR pr md
Område
The Hague Haagse Hout, The Hague
Type
Office space
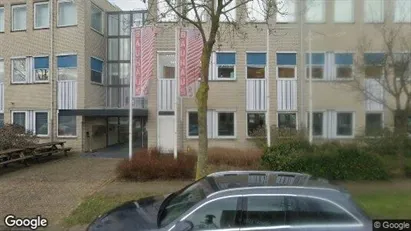
Office space in Bunnik, Province of Utrecht
 More info
Office space in Bunnik, Province of Utrecht
Office space for rent in Bunnik, Province of Utrecht
Areal
-
Pris pr. md.
Not stated
Område
Bunnik, Province of Utrecht
Type
Office space
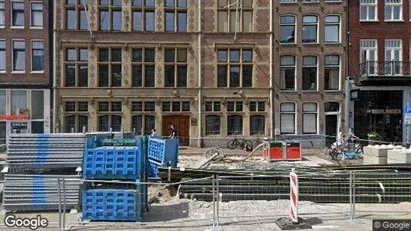
Office space in Amsterdam Centrum, Amsterdam
 More info
Office space in Amsterdam Centrum, Amsterdam
Office space for rent in Amsterdam Centrum, Amsterdam
Areal
Ca. 100 m2
Pris pr. md.
Ca. 3,550 EUR pr md
Område
Amsterdam Centrum, Amsterdam
Type
Office space
Clinic in Copenhagen K, Copenhagen
 More info
Clinic in Copenhagen K, Copenhagen
Clinic for rent in Copenhagen K, Copenhagen
Areal
Ca. 15 m2
Pris pr. md.
Ca. 7,200 DKK pr md
Område
Copenhagen K, Copenhagen
Type
Clinic
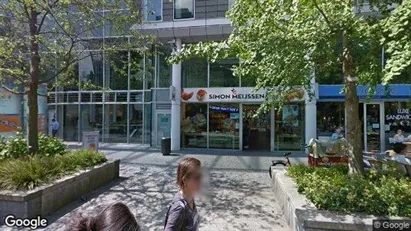
Office space in Amsterdam Oud-Zuid, Amsterdam
 More info
Office space in Amsterdam Oud-Zuid, Amsterdam
Office space for rent in Amsterdam Oud-Zuid, Amsterdam
Areal
Ca. 80 m2
Pris pr. md.
Ca. 3,250 EUR pr md
Område
Amsterdam Oud-Zuid, Amsterdam
Type
Office space
Office space in Amsterdam Zuideramstel, Amsterdam
 More info
Office space in Amsterdam Zuideramstel, Amsterdam
Office space for rent in Amsterdam Zuideramstel, Amsterdam
Areal
Ca. 75 m2
Pris pr. md.
Ca. 2,150 EUR pr md
Område
Amsterdam Zuideramstel, Amsterdam
Type
Office space
Commercial space in Norrköping, Östergötland County
 More info
Commercial space in Norrköping, Östergötland County
Commercial space for rent in Norrköping, Östergötland County
Areal
Ca. 80 m2
Pris pr. md.
Ca. 8,300 SEK pr md
Område
Norrköping, Östergötland County
Type
Commercial property
Warehouse in Herning, Central Jutland Region
More info
Warehouse in Herning, Central Jutland Region
Warehouse for rent in Herning, Central Jutland Region
Areal
Ca. 85 m2
Pris pr. md.
Ca. 3,800 DKK pr md
Område
Herning, Central Jutland Region
Type
Warehouse
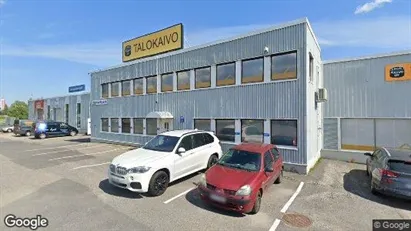
Commercial space in Tampere Eteläinen, Tampere
 More info
Commercial space in Tampere Eteläinen, Tampere
Commercial space for rent in Tampere Eteläinen, Tampere
Areal
Ca. 525 m2
Pris pr. md.
Not stated
Område
Tampere Eteläinen, Tampere
Type
Commercial property
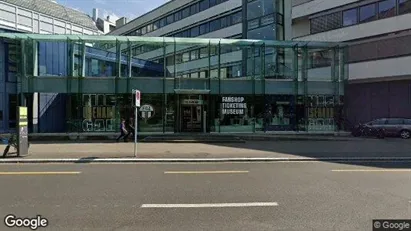
Office space in Zürich Distrikt 4 - Aussersihl, Zürich
 More info
Office space in Zürich Distrikt 4 - Aussersihl, Zürich
Office space for rent in Zürich Distrikt 4 - Aussersihl, Zürich
Areal
-
Pris pr. md.
Not stated
Område
Zürich Distrikt 4 - Aussersihl, Zürich
Type
Office space
Office space in Amsterdam Centrum, Amsterdam
 More info
Office space in Amsterdam Centrum, Amsterdam
Office space for rent in Amsterdam Centrum, Amsterdam
Areal
Ca. 75 m2
Pris pr. md.
Ca. 2,850 EUR pr md
Område
Amsterdam Centrum, Amsterdam
Type
Office space
Office space in Hellerup, Greater Copenhagen
More info
Office space in Hellerup, Greater Copenhagen
Office space for rent in Hellerup, Greater Copenhagen
Areal
Ca. 20 m2
Pris pr. md.
Ca. 11,000 DKK pr md
Område
Hellerup, Greater Copenhagen
Type
Office space
Office space in Groningen, Groningen (region)
 More info
Office space in Groningen, Groningen (region)
Office space for rent in Groningen, Groningen (region)
Areal
-
Pris pr. md.
Ca. 2,650 EUR pr md
Område
Groningen, Groningen (region)
Type
Office space
Office space in Haarlemmermeer, North Holland
 More info
Office space in Haarlemmermeer, North Holland
Office space for rent in Haarlemmermeer, North Holland
Areal
Ca. 10 m2
Pris pr. md.
Ca. 150 EUR pr md
Område
Haarlemmermeer, North Holland
Type
Office space
Office space in Haarlemmermeer, North Holland
 More info
Office space in Haarlemmermeer, North Holland
Office space for rent in Haarlemmermeer, North Holland
Areal
Ca. 50 m2
Pris pr. md.
Ca. 2,700 EUR pr md
Område
Haarlemmermeer, North Holland
Type
Office space
Office space in Amsterdam Centrum, Amsterdam
 More info
Office space in Amsterdam Centrum, Amsterdam
Office space for rent in Amsterdam Centrum, Amsterdam
Areal
Ca. 45 m2
Pris pr. md.
Ca. 4,000 EUR pr md
Område
Amsterdam Centrum, Amsterdam
Type
Office space
Commercial space in Midden-Drenthe, Drenthe
 More info
Commercial space in Midden-Drenthe, Drenthe
Commercial space for rent in Midden-Drenthe, Drenthe
Areal
Ca. 860 m2
Pris pr. md.
Ca. 389,000 EUR pr md
Område
Midden-Drenthe, Drenthe
Type
Commercial property
Office space in Stad Antwerp, Antwerp
 More info
Office space in Stad Antwerp, Antwerp
Office space for rent in Stad Antwerp, Antwerp
Areal
Ca. 850 m2
Pris pr. md.
Ca. 9,200 EUR pr md
Område
Stad Antwerp, Antwerp
Type
Office space
Selected customers
30,000 customers use Companyspace.com
30,000 customers
285,000 companies in our database
2,400 rentals annually
Companyspace.com is used by thousands of landlords, property companies, commercial real estate agents, investors and business centres seeking greater visibility, more enquiries and lower vacancy rates.


