


Commercial premises for rent in Europe
There are 282,277 available commercial properties in Europe right now. Companyspace.com collects commercial properties from many different parts of the market, so that you as a company can more easily get an overview of available commercial properties in Europe.
Companyspace.com today:
New today 268
Updated 24h 1,330
Notifications about new companyspaces23
Copenhagen +2
Vienna +1
Paris +5
Dublin (county) +48
Warsaw +12
Greater London +1
Latest update 1 min ago
Active ads 369,502
282,277 company spaces found
Office space in Dortmund, Nordrhein-Westfalen
More info
We monitor the market!
Office space in Dortmund, Nordrhein-Westfalen
Büroflächen, die zu unterschiedlichen Teamgrößen, Raumkonzepten und Wachstumsplänen passen
In unserem Business Center bieten wir eine große Auswahl an Bür...
Areal
Ca. 3,235 m2
Pris pr. md.
Not stated
Område
Dortmund, Nordrhein-Westfalen
Type
Office space
Office space in Leipzig, Sachsen
More info
We monitor the market!
Office space in Leipzig, Sachsen
Erweitern Sie Ihr Geschäft in unserem stilvollen Büro in Leipzig, der bevölkerungsreichsten Stadt des Bundeslandes Sachsen. Werden Sie Teil einer florierende...
Areal
Ca. 5 m2
Pris pr. md.
Not stated
Område
Leipzig, Sachsen
Type
Office space
Office space in Cologne Innenstadt, Cologne (region)
More info
We monitor the market!
Office space in Cologne Innenstadt, Cologne (region)
Büroflächen für jede Teamgröße; in unserem Business Center in KölnTurm in Köln
Entdecken Sie unser umfangreiches Angebot an vollständig möblierten Büroflä...
Areal
Ca. 1,480 m2
Pris pr. md.
Not stated
Område
Cologne Innenstadt, Cologne (region)
Type
Office space
Office space in Hamburg Nord, Hamburg
More info
We monitor the market!
Office space in Hamburg Nord, Hamburg
Büroflächen für jede Teamgröße; in unserem Business Center in City Nord in Hamburg
Entdecken Sie unser umfangreiches Angebot an vollständig möblierten Bür...
Areal
Ca. 1,580 m2
Pris pr. md.
Not stated
Område
Hamburg Nord, Hamburg
Type
Office space
Office space in Hamburg Mitte, Hamburg
More info
We monitor the market!
Office space in Hamburg Mitte, Hamburg
Büroflächen, die zu unterschiedlichen Teamgrößen, Raumkonzepten und Wachstumsplänen passen
In unserem Business Center bieten wir eine große Auswahl an Bür...
Areal
Ca. 775 m2
Pris pr. md.
Not stated
Område
Hamburg Mitte, Hamburg
Type
Office space
Office space in Oberhaching, Bayern
More info
We monitor the market!
Office space in Oberhaching, Bayern
Produktiver Arbeitsplatz für drei Personen, bei dem Sie sich um nichts mehr kümmern müssen.
Dieses Angebot umfasst einen privaten Serviced-Office-Bereich fü...
Areal
Ca. 15 m2
Pris pr. md.
Not stated
Område
Oberhaching, Bayern
Type
Office space
Office space in Berlin Friedrichshain-Kreuzberg, Berlin
More info
We monitor the market!
Office space in Berlin Friedrichshain-Kreuzberg, Berlin
Büroflächen für jede Teamgröße; in unserem Business Center in Villa Grumbt in Dresden
Entdecken Sie unser umfangreiches Angebot an vollständig möblierten ...
Areal
Ca. 1,125 m2
Pris pr. md.
Not stated
Område
Berlin Friedrichshain-Kreuzberg, Berlin
Type
Office space
Office space in Munich Schwabing-Freimann, Munich
More info
We monitor the market!
Office space in Munich Schwabing-Freimann, Munich
Von kleinen Teams bis hin zu wachsenden Unternehmen – das passende Büro sieht für jeden anders aus.
Deshalb bieten wir eine breite Auswahl an Bürolösungen...
Areal
Ca. 1,120 m2
Pris pr. md.
Not stated
Område
Munich Schwabing-Freimann, Munich
Type
Office space
Industrial property in Dragoman, Yugozapaden
 More info
Industrial property in Dragoman, Yugozapaden
🏭 WAREHOUSE FOR RENT — KALOTINA | Direct access to Europa Motorway
📍 Sofia Region, Dragoman Municipality, Kalotina
🛣️ Only 2 minutes from the newly bu...
Areal
Ca. 240 m2
Pris pr. md.
Not stated
Område
Dragoman, Yugozapaden
Type
Industrial property
Coworking space in Vallensbæk, Greater Copenhagen
 More info
Coworking space in Vallensbæk, Greater Copenhagen
Coworking space for rent in Vallensbæk, Greater Copenhagen
Areal
1 - 10 locations
Pris pr. md.
Not stated
Område
Vallensbæk, Greater Copenhagen
Type
Coworking space
Coworking space in Åbyhøj, Aarhus
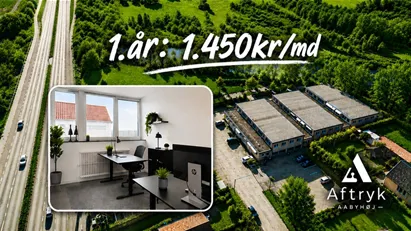 More info
Coworking space in Åbyhøj, Aarhus
Coworking space for rent in Åbyhøj, Aarhus
Areal
1 - 2 locations
Pris pr. md.
Not stated
Område
Åbyhøj, Aarhus
Type
Coworking space
Commercial space in Stad Antwerp, Antwerp
 More info
Commercial space in Stad Antwerp, Antwerp
Een serene, multifunctionele studio op een unieke locatie:
Brouwersvliet 19/21, op wandelafstand van het MAS, met zicht op de Schelde.
A serene space — b...
Areal
Ca. 210 m2
Pris pr. md.
Not stated
Område
Stad Antwerp, Antwerp
Type
Commercial property
Industrial property in Muri, Aargau (Kantone)
 More info
Industrial property in Muri, Aargau (Kantone)
An der Bahnhofstrasse 27 in CH-5647 Oberrüti vermieten wir ein grosszügiges Gewerbe- und Lagerobjekt mit funktionaler Infrastruktur und flexiblen Nutzungsmög...
Areal
Ca. 3,500 m2
Pris pr. md.
Not stated
Område
Muri, Aargau (Kantone)
Type
Industrial property
Office space in Hamburg Mitte, Hamburg
More info
We monitor the market!
Office space in Hamburg Mitte, Hamburg
Büroflächen für jede Teamgröße; in unserem Business Center in Speicherstadt in Hamburg
Entdecken Sie unser umfangreiches Angebot an vollständig möblierten...
Areal
Ca. 2,830 m2
Pris pr. md.
Not stated
Område
Hamburg Mitte, Hamburg
Type
Office space
Office space in Hochtaunuskreis, Hessen
More info
We monitor the market!
Office space in Hochtaunuskreis, Hessen
Entdecken Sie für Ihr Unternehmen eine neue Art zu arbeiten mit Büroräumen im gut situierten Kurort Bad Homburg in unmittelbarer Nähe zu Frankfurt. Nutzen Si...
Areal
Ca. 5 m2
Pris pr. md.
Not stated
Område
Hochtaunuskreis, Hessen
Type
Office space
Office space in Kiel, Schleswig-Holstein
More info
We monitor the market!
Office space in Kiel, Schleswig-Holstein
Büroflächen, die zu unterschiedlichen Teamgrößen, Raumkonzepten und Wachstumsplänen passen
In unserem Business Center bieten wir eine große Auswahl an Bür...
Areal
Ca. 1,340 m2
Pris pr. md.
Not stated
Område
Kiel, Schleswig-Holstein
Type
Office space
Office space in Augsburg, Bayern
More info
We monitor the market!
Office space in Augsburg, Bayern
Bauen Sie Ihre Geschäftspräsenz schnell auf – mit einer sofortigen professionellen Unternehmensadresse und den Services für virtuelle Büros, die Sie brauchen...
Areal
Ca. 5 m2
Pris pr. md.
Not stated
Område
Augsburg, Bayern
Type
Office space
Office space in Berlin Friedrichshain-Kreuzberg, Berlin
More info
We monitor the market!
Office space in Berlin Friedrichshain-Kreuzberg, Berlin
Ergreifen Sie von einem sicheren, professionellen Büro im Herzen von Dresdens Geschäftsviertel aus wichtige Maßnahmen, um Ihr Unternehmen voranzubringen. Pos...
Areal
Ca. 5 m2
Pris pr. md.
Not stated
Område
Berlin Friedrichshain-Kreuzberg, Berlin
Type
Office space
Selected customers
30,000 customers use Companyspace.com
30,000 customers
285,000 companies in our database
2,400 rentals annually
Companyspace.com is used by thousands of landlords, property companies, commercial real estate agents, investors and business centres seeking greater visibility, more enquiries and lower vacancy rates.


