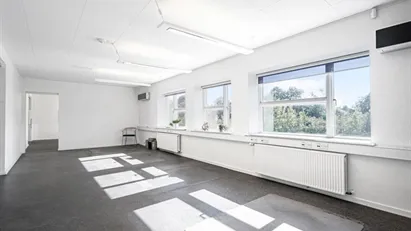
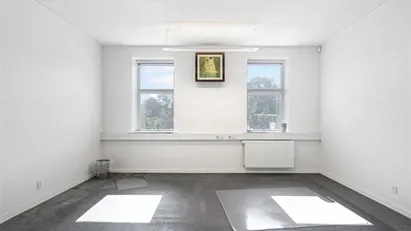
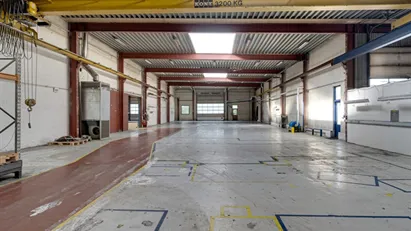
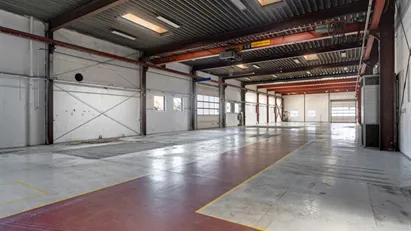
Commercial space
See all available business premises, commercial properties and commercial spaces below. If you are looking for commercial real estate, business space, a business premise or commercial space, you have come to the right place. We have most available commercial spaces in our database. Find your business premise here. Enjoy.
312,561 company spaces found
-
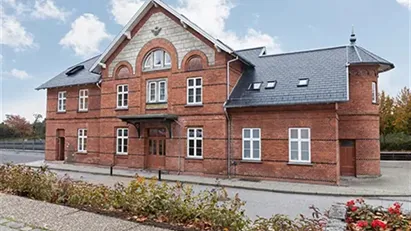
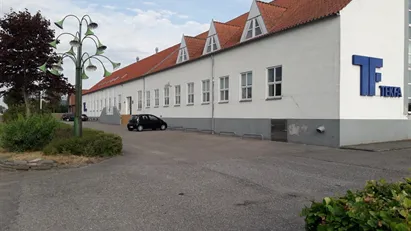
320 m2 restaurant for rent in Fredericia, Region of Southern Denmark
- 28,000 DKK per month
- 1,050 DKK /m2/year
-
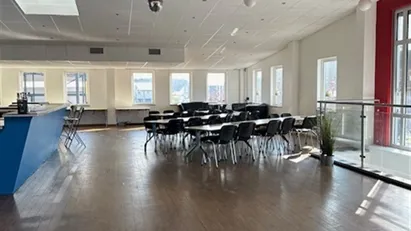
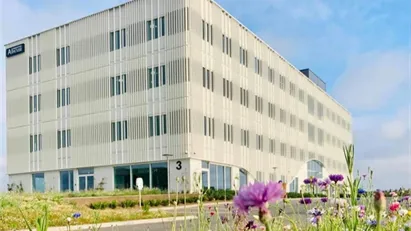
188 m2 office space for rent in Gothenburg City Centre, Gothenburg
- 27,500 SEK per month
- 1,755 SEK /m2/year
-
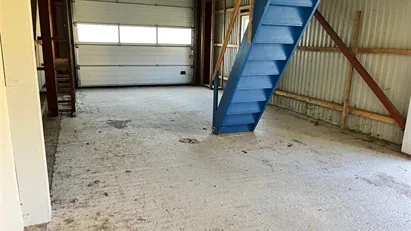
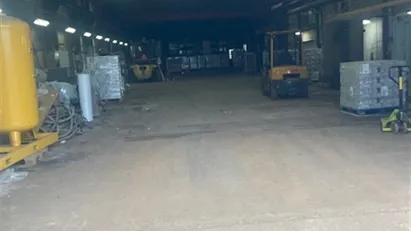
500 m2 warehouse for rent in Ullerslev, Funen
- 12,292 DKK per month
- 295 DKK /m2/year
-
16 m2 office space for rent in Ullerslev, Funen
- 393 DKK per month
- 295 DKK /m2/year
-
38 m2 office space for rent in Ullerslev, Funen
- 934 DKK per month
- 295 DKK /m2/year
-
18 m2 office space for rent in Ullerslev, Funen
- 442 DKK per month
- 295 DKK /m2/year
-
2000 m2 warehouse for rent in Ullerslev, Funen
- 49,167 DKK per month
- 295 DKK /m2/year
-
60 m2 warehouse for rent in Middelfart, Funen
- 2,000 DKK per month
- 400 DKK /m2/year
-
280 m2 commercial space for rent in Kävlinge, Skåne County
- 23,333 SEK per month
- 1,000 SEK /m2/year
-
17 m2 office space for rent in Hadsten, Central Jutland Region
- 3,200 DKK per month
- 2,258 DKK /m2/year
-
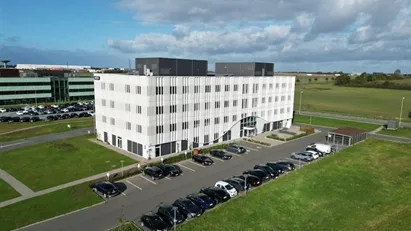
532 m2 office space for rent in Vejle, Vejle (region)
- 67,387 DKK per month
- 1,520 DKK /m2/year
-
284 m2 office space for rent in Vejle, Vejle (region)
- 35,973 DKK per month
- 1,520 DKK /m2/year
-
550 m2 warehouse for rent in Nyborg, Funen
- 13,000 DKK per month
- 283 DKK /m2/year
Frequently asked questions
Statistics on the development of available commercial real estate for rent over the past month
Also see aggregate statistics on all available commercial rentals over time, aggregate statistics on new commercial rentals over time, aggregate statistics on rented commercial real estate over time
| Date | |||
|---|---|---|---|
| 17. January 2026 | 328036 | 3051 | 2479 |
| 16. January 2026 | 327464 | 6290 | 4848 |
| 15. January 2026 | 326022 | 1440 | 1733 |
| 14. January 2026 | 326315 | 6748 | 6176 |
| 13. January 2026 | 325743 | 4889 | 3246 |
| 12. January 2026 | 324100 | 1873 | 8639 |
| 11. January 2026 | 330866 | 7721 | 7292 |
| 10. January 2026 | 330437 | 4744 | 2217 |
| 9. January 2026 | 327910 | 9079 | 10780 |
| 8. January 2026 | 329611 | 6878 | 3377 |
| 7. January 2026 | 326110 | 7475 | 3716 |
| 6. January 2026 | 322351 | 3731 | 1176 |
| 5. January 2026 | 319796 | 5380 | 6515 |
| 4. January 2026 | 320931 | 2497 | 1314 |
| 3. January 2026 | 319748 | 4594 | 3562 |
| 2. January 2026 | 318716 | 3255 | 5139 |
| 1. January 2026 | 320600 | 2658 | 3343 |
| 31. December 2025 | 321285 | 3040 | 3291 |
| 30. December 2025 | 321536 | 7143 | 6327 |
| 29. December 2025 | 320720 | 2802 | 290 |
| 28. December 2025 | 318208 | 5132 | 4591 |
| 27. December 2025 | 317667 | 2827 | 2805 |
| 26. December 2025 | 317645 | 5100 | 4482 |
| 25. December 2025 | 317027 | 2753 | 1388 |
| 24. December 2025 | 315662 | 9262 | 9768 |
| 23. December 2025 | 316168 | 2700 | 6 |
| 22. December 2025 | 313474 | 5384 | 5321 |
| 21. December 2025 | 313411 | 3481 | 4942 |
| 20. December 2025 | 314872 | 4217 | 4514 |
| 19. December 2025 | 315169 | 4409 | 5066 |
| 18. December 2025 | 315826 | 2611 | 0 |
Statistics on currently available commercial spaces
Also see gathered statistics of all available commercial space over time, the gathered statistics of new commercial space over time, the gathered statistics of rented commercial space over time
| Total | |
|---|---|
| Available premises | 312,528 |
| New premises since yesterday | 3,051 |
| Rented out premises since yesterday | 2,479 |
| Total available m2 | 3,867,513,035 |
| Average price per m2 per year without expenses | 24,325 |
| Highest price per m2 per year | 45,000,000 |
| Lowest price per m2 per year | 1 |


