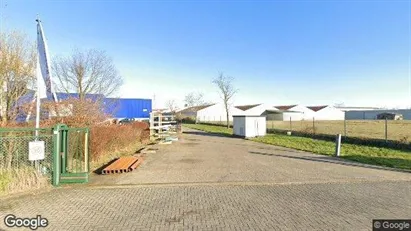
Commercial space in Antwerp (Province)
See all available business premises, commercial properties and commercial spaces in Antwerp (Province) below. If you are looking for commercial real estate, business space, a business premise or commercial space in Antwerp (Province), you have come to the right place. We have most available commercial spaces in Antwerp (Province) in our database. Find your business premise in Antwerp (Province) here. Enjoy.
3,339 company spaces found
-
11110 m2 warehouse for rent in Willebroek, Antwerp (Province)
- 61,212 EUR per month
- 66.12 EUR /m2/year
-
40 m2 office space for rent in Mechelen, Antwerp (Province)
- 450 EUR per month
- 135 EUR /m2/year
-
1514 m2 office space for rent in Antwerp Berchem, Antwerp
- 6,113 EUR per month
- 48.45 EUR /m2/year
-
25942 m2 warehouse for rent in Boom, Antwerp (Province)
- 65,757 EUR per month
- 30.42 EUR /m2/year
-
2877 m2 office space for rent in Mechelen, Antwerp (Province)
- 1,721 EUR per month
- 7.18 EUR /m2/year
-
321 m2 office space for rent in Mechelen, Antwerp (Province)
- 2,688 EUR per month
- 100.49 EUR /m2/year
-
363 m2 office space for rent in Stad Antwerp, Antwerp
- 1,625 EUR per month
- 53.72 EUR /m2/year
-
800 m2 office space for rent in Stad Antwerp, Antwerp
- 6,667 EUR per month
- 100 EUR /m2/year
-
1361 m2 office space for rent in Mechelen, Antwerp (Province)
- 688 EUR per month
- 6.07 EUR /m2/year
-
1868 m2 office space for rent in Antwerp Berchem, Antwerp
- 8,463 EUR per month
- 54.37 EUR /m2/year
-
769 m2 office space for rent in Stad Antwerp, Antwerp
- 3,888 EUR per month
- 60.67 EUR /m2/year
-
29000 m2 commercial space for rent in Antwerp Wilrijk, Antwerp
- 5,500 EUR per month
- 2.28 EUR /m2/year
-
808 m2 office space for rent in Antwerp Berchem, Antwerp
- 4,198 EUR per month
- 62.35 EUR /m2/year
-
1260 m2 warehouse for rent in Malle, Antwerp (Province)
- 1,531 EUR per month
- 14.58 EUR /m2/year
Frequently asked questions
Statistics on the development of available commercial real estate for rent in Antwerp (Province) over the past month
Also see aggregate statistics on all available commercial rentals in Antwerp (Province) over time, aggregate statistics on new commercial rentals in Antwerp (Province) over time, aggregate statistics on rented commercial real estate in Antwerp (Province) over time
| Date | |||
|---|---|---|---|
| 25. October 2025 | 3418 | 23 | 56 |
| 24. October 2025 | 3451 | 125 | 111 |
| 23. October 2025 | 3437 | 118 | 93 |
| 22. October 2025 | 3412 | 19 | 3 |
| 21. October 2025 | 3396 | 36 | 39 |
| 20. October 2025 | 3399 | 7 | 105 |
| 19. October 2025 | 3497 | 86 | 75 |
| 18. October 2025 | 3486 | 22 | 36 |
| 17. October 2025 | 3500 | 71 | 66 |
| 16. October 2025 | 3495 | 119 | 84 |
| 15. October 2025 | 3460 | 120 | 142 |
| 14. October 2025 | 3482 | 78 | 14 |
| 13. October 2025 | 3418 | 82 | 79 |
| 12. October 2025 | 3415 | 51 | 83 |
| 11. October 2025 | 3447 | 5 | 22 |
| 10. October 2025 | 3464 | 86 | 113 |
| 9. October 2025 | 3491 | 39 | 19 |
| 8. October 2025 | 3471 | 109 | 119 |
| 7. October 2025 | 3481 | 26 | 10 |
| 6. October 2025 | 3465 | 38 | 63 |
| 5. October 2025 | 3490 | 46 | 52 |
| 4. October 2025 | 3496 | 35 | 13 |
| 3. October 2025 | 3474 | 85 | 58 |
| 2. October 2025 | 3447 | 24 | 73 |
| 1. October 2025 | 3496 | 36 | 47 |
| 30. September 2025 | 3507 | 48 | 40 |
| 29. September 2025 | 3499 | 10 | 8 |
| 28. September 2025 | 3497 | 36 | 36 |
| 27. September 2025 | 3497 | 74 | 79 |
| 26. September 2025 | 3502 | 75 | 57 |
| 25. September 2025 | 3484 | 0 | 0 |
Statistics on currently available commercial spaces in Antwerp (Province) in Belgium
Also see gathered statistics of all available commercial space in Antwerp (Province) over time, the gathered statistics of new commercial space in Antwerp (Province) over time, the gathered statistics of rented commercial space in Antwerp (Province) over time
| Total | |
|---|---|
| Available premises | 3,316 |
| New premises since yesterday | 23 |
| Rented out premises since yesterday | 56 |
| Total available m2 | 3,650,813 |
| Average price per m2 per year without expenses | 6,511 |
| Highest price per m2 per year | 1,877,376 |
| Lowest price per m2 per year | 1.02 |


