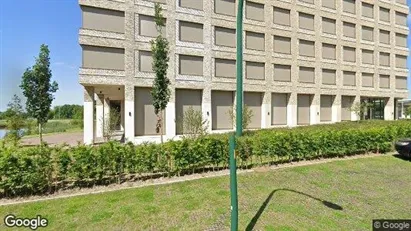
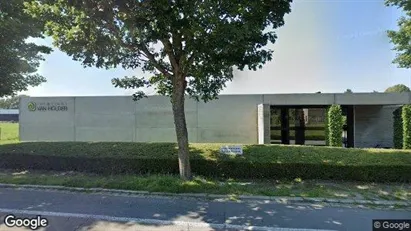
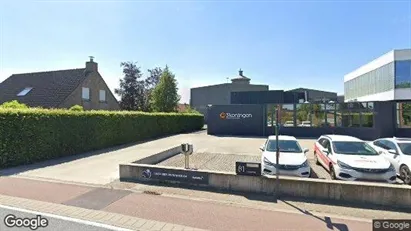
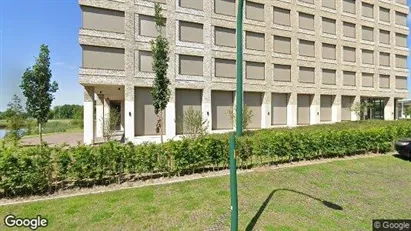
Available office spaces in West-Vlaanderen
See all available office spaces in West-Vlaanderen below. If you are looking for office space in West-Vlaanderen, you have come to the right place. We have most available office spaces in West-Vlaanderen in our database. Find office space in West-Vlaanderen here. Enjoy.
607 office spaces found
-
85 m2 office space for rent in Waregem, West-Vlaanderen
- 850 EUR per month
- 120 EUR /m2/year
-
84 m2 office space for rent in Roeselare, West-Vlaanderen
- 2,540 EUR per month
- 362.86 EUR /m2/year
-
240 m2 office space for rent in Knokke-Heist, West-Vlaanderen
- 1,990 EUR per month
- 99.50 EUR /m2/year
-
84 m2 office space for rent in Torhout, West-Vlaanderen
- 1,997 EUR per month
- 285.29 EUR /m2/year
-
797 m2 office space for rent in Waregem, West-Vlaanderen
- 6,975 EUR per month
- 105.02 EUR /m2/year
-
84 m2 office space for rent in Waregem, West-Vlaanderen
- 740 EUR per month
- 105.71 EUR /m2/year
-
425 m2 office space for rent in Kortrijk, West-Vlaanderen
- 5,135 EUR per month
- 144.99 EUR /m2/year
-
84 m2 office space for rent in Deerlijk, West-Vlaanderen
- 1,450 EUR per month
- 207.14 EUR /m2/year
-
32 m2 office space for rent in Torhout, West-Vlaanderen
- 875 EUR per month
- 328.12 EUR /m2/year
-
1375 m2 office space for rent in Kortrijk, West-Vlaanderen
- 16,615 EUR per month
- 145 EUR /m2/year
-
84 m2 office space for rent in Blankenberge, West-Vlaanderen
- 880 EUR per month
- 125.71 EUR /m2/year
-
180 m2 office space for rent in Ieper, West-Vlaanderen
- 895 EUR per month
- 59.67 EUR /m2/year
-
10 m2 office space for rent in Roeselare, West-Vlaanderen
- 99 EUR per month
- 118.80 EUR /m2/year
-
70 m2 office space for rent in Roeselare, West-Vlaanderen
- 965 EUR per month
- 165.43 EUR /m2/year
-
70 m2 office space for rent in Zwevegem, West-Vlaanderen
- 4,400 EUR per month
- 754.29 EUR /m2/year
-
70 m2 office space for rent in Kuurne, West-Vlaanderen
- 1,295 EUR per month
- 222 EUR /m2/year
-
70 m2 office space for rent in Roeselare, West-Vlaanderen
- 750 EUR per month
- 128.57 EUR /m2/year
-
70 m2 office space for rent in Menen, West-Vlaanderen
- 750 EUR per month
- 128.57 EUR /m2/year
Frequently asked questions
Statistics on the development of available office spaces for rent in West-Vlaanderen over the past month
Also see aggregate statistics on all available office spaces in West-Vlaanderen over time, aggregate statistics on new office spaces in West-Vlaanderen over time, aggregate statistics on rented office spaces in West-Vlaanderen over time
| Date | |||
|---|---|---|---|
| 20. October 2025 | 607 | 1 | 2 |
| 19. October 2025 | 608 | 6 | 10 |
| 18. October 2025 | 612 | 1 | 0 |
| 17. October 2025 | 611 | 2 | 1 |
| 16. October 2025 | 610 | 7 | 5 |
| 15. October 2025 | 608 | 6 | 3 |
| 14. October 2025 | 605 | 2 | 0 |
| 13. October 2025 | 603 | 2 | 2 |
| 12. October 2025 | 603 | 5 | 10 |
| 11. October 2025 | 608 | 3 | 0 |
| 10. October 2025 | 605 | 12 | 12 |
| 9. October 2025 | 605 | 4 | 0 |
| 8. October 2025 | 601 | 4 | 4 |
| 7. October 2025 | 601 | 0 | 6 |
| 6. October 2025 | 607 | 3 | 0 |
| 5. October 2025 | 604 | 2 | 5 |
| 4. October 2025 | 607 | 3 | 0 |
| 3. October 2025 | 604 | 3 | 3 |
| 2. October 2025 | 604 | 2 | 1 |
| 1. October 2025 | 603 | 1 | 1 |
| 30. September 2025 | 603 | 1 | 2 |
| 29. September 2025 | 604 | 1 | 0 |
| 28. September 2025 | 603 | 1 | 1 |
| 27. September 2025 | 603 | 4 | 7 |
| 26. September 2025 | 606 | 6 | 6 |
| 25. September 2025 | 606 | 0 | 0 |
| 24. September 2025 | 606 | 2 | 6 |
| 23. September 2025 | 610 | 1 | 0 |
| 22. September 2025 | 609 | 0 | 0 |
| 21. September 2025 | 609 | 5 | 6 |
| 20. September 2025 | 610 | 3 | 0 |
Statistics on currently available office spaces in West-Vlaanderen in Belgium
Also see gathered statistics of all available office spaces in West-Vlaanderen over time, the gathered statistics of new office spaces in West-Vlaanderen over time, the gathered statistics of rented office spaces in West-Vlaanderen over time
| Office spaces | |
|---|---|
| Available premises | 607 |
| New premises since yesterday | 1 |
| Rented out premises since yesterday | 2 |
| Total available m2 | 192,444 |
| Average price per m2 per year without expenses | 1,704 |
| Highest price per m2 per year | 211,800 |
| Lowest price per m2 per year | 7.14 |


