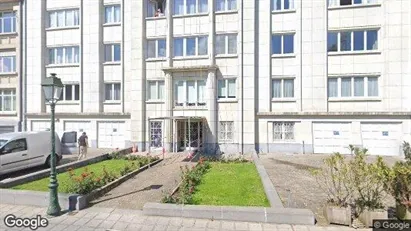
Available office spaces in Waals-Brabant
See all available office spaces in Waals-Brabant below. If you are looking for office space in Waals-Brabant, you have come to the right place. We have most available office spaces in Waals-Brabant in our database. Find office space in Waals-Brabant here. Enjoy.
259 office spaces found
-
30 m2 office space for rent in Waterloo, Waals-Brabant
- 389 EUR per month
- 155.60 EUR /m2/year
Frequently asked questions
Statistics on the development of available office spaces for rent in Waals-Brabant over the past month
Also see aggregate statistics on all available office spaces in Waals-Brabant over time, aggregate statistics on new office spaces in Waals-Brabant over time, aggregate statistics on rented office spaces in Waals-Brabant over time
| Date | |||
|---|---|---|---|
| 14. December 2025 | 259 | 55 | 0 |
| 13. December 2025 | 204 | 1 | 55 |
| 12. December 2025 | 258 | 1 | 2 |
| 11. December 2025 | 259 | 33 | 0 |
| 10. December 2025 | 226 | 0 | 34 |
| 9. December 2025 | 260 | 0 | 0 |
| 8. December 2025 | 260 | 59 | 58 |
| 7. December 2025 | 259 | 57 | 0 |
| 6. December 2025 | 202 | 1 | 1 |
| 5. December 2025 | 202 | 0 | 57 |
| 4. December 2025 | 259 | 2 | 2 |
| 3. December 2025 | 259 | 58 | 57 |
| 2. December 2025 | 258 | 57 | 0 |
| 1. December 2025 | 201 | 4 | 60 |
| 30. November 2025 | 257 | 3 | 0 |
| 29. November 2025 | 254 | 4 | 4 |
| 28. November 2025 | 254 | 1 | 1 |
| 27. November 2025 | 254 | 8 | 8 |
| 26. November 2025 | 254 | 0 | 4 |
| 25. November 2025 | 258 | 2 | 282 |
| 24. November 2025 | 538 | 1 | 1 |
| 23. November 2025 | 538 | 72 | 72 |
| 22. November 2025 | 538 | 66 | 0 |
| 21. November 2025 | 472 | 6 | 0 |
| 20. November 2025 | 466 | 2 | 77 |
| 19. November 2025 | 541 | 15 | 13 |
| 18. November 2025 | 539 | 11 | 0 |
| 17. November 2025 | 528 | 1 | 8 |
| 16. November 2025 | 535 | 62 | 62 |
| 15. November 2025 | 535 | 61 | 0 |
| 14. November 2025 | 474 | 3 | 0 |
Statistics on currently available office spaces in Waals-Brabant in Belgium
Also see gathered statistics of all available office spaces in Waals-Brabant over time, the gathered statistics of new office spaces in Waals-Brabant over time, the gathered statistics of rented office spaces in Waals-Brabant over time
| Office spaces | |
|---|---|
| Available premises | 259 |
| New premises since yesterday | 55 |
| Rented out premises since yesterday | 0 |
| Total available m2 | 292,839 |
| Average price per m2 per year without expenses | 32,540 |
| Highest price per m2 per year | 843,480 |
| Lowest price per m2 per year | 65.67 |


