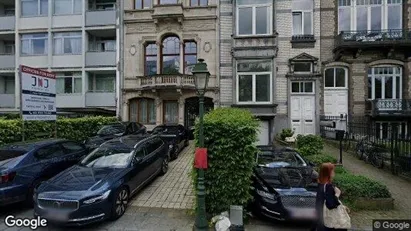
Available office spaces in Brussels
See all available office spaces in Brussels below. If you are looking for office space in Brussels, you have come to the right place. We have most available office spaces in Brussels in our database. Find office space in Brussels here. Enjoy.
678 office spaces found
-
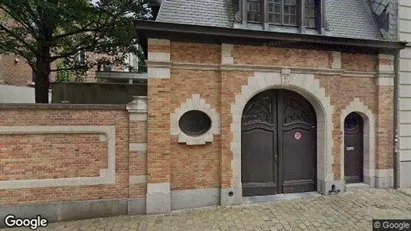
1200 m2 office space for rent in Brussels Etterbeek, Brussels
- Ca. 350 EUR per month
- Ca. 50 EUR /m2/year
-
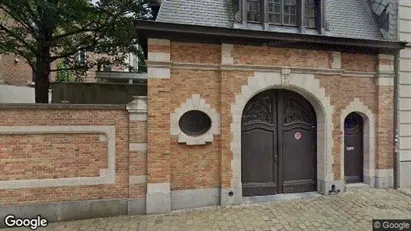
665 m2 office space for rent in Stad Brussel, Brussels
- Ca. 1,300 EUR per month
- Ca. 50 EUR /m2/year
-
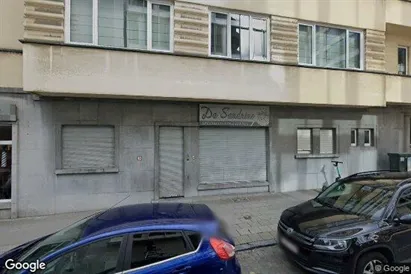
110 m2 office space for rent in Brussels Sint-Jans-Molenbeek, Brussels
- Ca. 250 EUR per month
- Ca. 50 EUR /m2/year
-
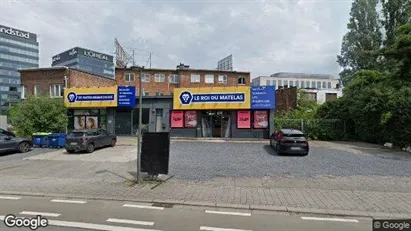
110 m2 office space for rent in Stad Brussel, Brussels
- Ca. 2,500 EUR per month
- Ca. 250 EUR /m2/year
-
110 m2 office space for rent in Stad Brussel, Brussels
- Ca. 2,650 EUR per month
- Ca. 300 EUR /m2/year
-
1200 m2 office space for rent in Brussels Etterbeek, Brussels
- Ca. 350 EUR per month
- Ca. 50 EUR /m2/year
-
1200 m2 office space for rent in Stad Brussel, Brussels
- Ca. 400 EUR per month
- Ca. 50 EUR /m2/year
-
1200 m2 office space for rent in Brussels Sint-Joost-ten-Node, Brussels
- Ca. 300 EUR per month
- Ca. 50 EUR /m2/year
-
1200 m2 office space for rent in Brussels Elsene, Brussels
- Ca. 400 EUR per month
- Ca. 50 EUR /m2/year
-
1200 m2 office space for rent in Stad Brussel, Brussels
- Ca. 350 EUR per month
- Ca. 50 EUR /m2/year
-
1200 m2 office space for rent in Brussels Anderlecht, Brussels
- Ca. 250 EUR per month
- Ca. 50 EUR /m2/year
-
1200 m2 office space for rent in Brussels Sint-Agatha-Berchem, Brussels
- Ca. 250 EUR per month
- Ca. 50 EUR /m2/year
-
1200 m2 office space for rent in Brussels Oudergem, Brussels
- Ca. 300 EUR per month
- Ca. 50 EUR /m2/year
-
165 m2 office space for rent in Brussels Etterbeek, Brussels
- Ca. 2,000 EUR per month
- Ca. 150 EUR /m2/year
-
280 m2 office space for rent in Stad Brussel, Brussels
- Ca. 5,000 EUR per month
- Ca. 200 EUR /m2/year
-
191 m2 office space for rent in Brussels Sint-Pieters-Woluwe, Brussels
- Ca. 1,000 EUR per month
- Ca. 50 EUR /m2/year
-
200 m2 office space for rent in Brussels Sint-Pieters-Woluwe, Brussels
- Ca. 1,400 EUR per month
- Ca. 100 EUR /m2/year
Frequently asked questions
Statistics on the development of available office spaces for rent in Brussels over the past month
Also see aggregate statistics on all available office spaces in Brussels over time, aggregate statistics on new office spaces in Brussels over time, aggregate statistics on rented office spaces in Brussels over time
| Date | |||
|---|---|---|---|
| 26. January 2026 | 653 | 0 | 17 |
| 25. January 2026 | 670 | 11 | 0 |
| 24. January 2026 | 659 | 7 | 17 |
| 23. January 2026 | 669 | 13 | 16 |
| 22. January 2026 | 672 | 41 | 45 |
| 21. January 2026 | 676 | 2 | 4 |
| 20. January 2026 | 678 | 5 | 8 |
| 19. January 2026 | 681 | 2 | 23 |
| 18. January 2026 | 702 | 16 | 9 |
| 17. January 2026 | 695 | 7 | 0 |
| 16. January 2026 | 688 | 43 | 40 |
| 15. January 2026 | 685 | 3 | 4 |
| 14. January 2026 | 686 | 22 | 19 |
| 13. January 2026 | 683 | 45 | 36 |
| 12. January 2026 | 674 | 36 | 0 |
| 11. January 2026 | 638 | 23 | 59 |
| 10. January 2026 | 674 | 25 | 0 |
| 9. January 2026 | 649 | 13 | 35 |
| 8. January 2026 | 671 | 32 | 25 |
| 7. January 2026 | 664 | 24 | 2 |
| 6. January 2026 | 642 | 10 | 0 |
| 5. January 2026 | 632 | 8 | 31 |
| 4. January 2026 | 655 | 0 | 0 |
| 3. January 2026 | 655 | 26 | 26 |
| 2. January 2026 | 655 | 15 | 0 |
| 1. January 2026 | 640 | 4 | 22 |
| 31. December 2025 | 658 | 4 | 0 |
| 30. December 2025 | 654 | 18 | 24 |
| 29. December 2025 | 660 | 77 | 0 |
| 28. December 2025 | 583 | 28 | 29 |
| 27. December 2025 | 584 | 0 | 0 |
Statistics on currently available office spaces in Brussels in Belgium
Also see gathered statistics of all available office spaces in Brussels over time, the gathered statistics of new office spaces in Brussels over time, the gathered statistics of rented office spaces in Brussels over time
| Office spaces | |
|---|---|
| Available premises | 653 |
| New premises since yesterday | 0 |
| Rented out premises since yesterday | 17 |
| Total available m2 | 778,838 |
| Average price per m2 per year without expenses | 135,014 |
| Highest price per m2 per year | 2,059,584 |
| Lowest price per m2 per year | 2.3 |


