


Industrial properties in Wijnegem
These commercial premises are closest to your search
We currently have no available commercial premises registered that match your search exactly. Therefore, we show below the commercial premises that best match your search based on the current market.
The shown listings may differ from your original search in terms of, for example, premises type, location, size or price, but they have been selected because they may be relevant alternatives for your business.
Take a look at the suggestions below – or start your search again here.
Companyspace.com today:
Updated 24h 1,197
Notifications about new companyspaces136
Latest update 2 h ago
Active ads 365,302
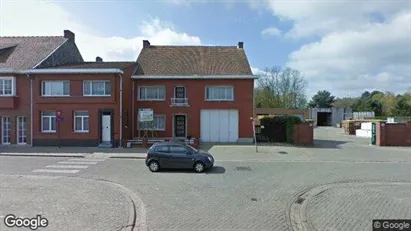
Commercial space in Boom, Antwerp (Province)
 More info
Commercial space in Boom, Antwerp (Province)
Commercial space for rent in Boom, Antwerp (Province)
Areal
Ca. 105 m2
Pris pr. md.
Ca. 1,150 EUR pr md
Område
Boom, Antwerp (Province)
Type
Commercial property
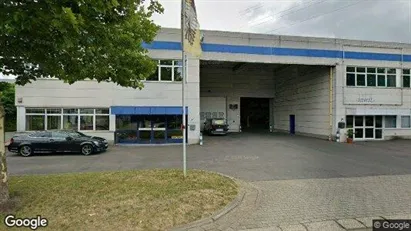
Warehouse in Lille, Antwerp (Province)
 More info
Warehouse in Lille, Antwerp (Province)
MAGAZIJN 130 M2 TE HUUR GIERLE
magazijn te huur centrum GIERLE , 130 m2 ,droog, vorstvrij , enkel voor opslag goederen en kleine werkzaamheden , electricite...
Areal
Ca. 130 m2
Pris pr. md.
Ca. 650 EUR pr md
Område
Lille, Antwerp (Province)
Type
Warehouse
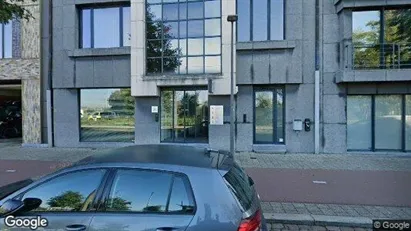
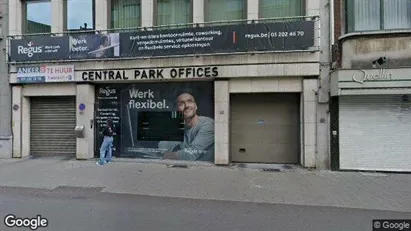
Office space in Mechelen, Antwerp (Province)
 More info
Office space in Mechelen, Antwerp (Province)
Aparte inkom, met wachtruimte en toilet, receptie, 3 aparte ruimtes, 1 ervan afgesloten met een glazen schuifwand, Douchecabine, koelkast en koffieapparaat b...
Areal
Ca. 55 m2
Pris pr. md.
Ca. 800 EUR pr md
Område
Mechelen, Antwerp (Province)
Type
Office space
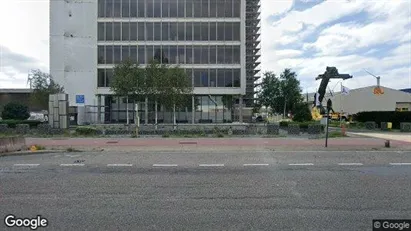
Showroom in Stad Antwerp, Antwerp
 More info
Showroom in Stad Antwerp, Antwerp
Are you looking for the perfect location for your business? This commercial space in vibrant Antwerp South offers everything you need:
✅ Excellent accessi...
Areal
Ca. 215 m2
Pris pr. md.
Ca. 2,500 EUR pr md
Område
Stad Antwerp, Antwerp
Type
Showroom
Commercial space in Stad Antwerp, Antwerp
 More info
Commercial space in Stad Antwerp, Antwerp
Een serene, multifunctionele studio op een unieke locatie:
Brouwersvliet 19/21, op wandelafstand van het MAS, met zicht op de Schelde.
A serene space — b...
Areal
Ca. 210 m2
Pris pr. md.
Not stated
Område
Stad Antwerp, Antwerp
Type
Commercial property
Warehouse in Puurs-Sint-Amands, Antwerp (Province)
 More info
Warehouse in Puurs-Sint-Amands, Antwerp (Province)
Warehouse for rent in Puurs-Sint-Amands, Antwerp (Province)
Areal
Ca. 4,000 m2
Pris pr. md.
Not stated
Område
Puurs-Sint-Amands, Antwerp (Province)
Type
Warehouse
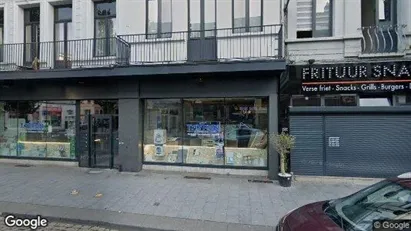
Shop in Stad Antwerp, Antwerp
 More info
Shop in Stad Antwerp, Antwerp
Bent u op zoek naar een ideale locatie voor uw zaak? Deze handelsruimte in het bruisende Antwerpen Zuid biedt alles wat u nodig hebt:
Uitstekende bereikba...
Areal
Ca. 230 m2
Pris pr. md.
Not stated
Område
Stad Antwerp, Antwerp
Type
Shop
Office space in Stad Antwerp, Antwerp
 More info
Office space in Stad Antwerp, Antwerp
Office space for rent in Stad Antwerp, Antwerp
Areal
142 - 585 m2
Pris pr. md.
Ca. 2,300 EUR pr md
Område
Stad Antwerp, Antwerp
Type
Office space
Office space in Antwerp Berchem, Antwerp
 More info
Office space in Antwerp Berchem, Antwerp
Office space for rent in Antwerp Berchem, Antwerp
Areal
455 - 1,116 m2
Pris pr. md.
Ca. 13,950 EUR pr md
Område
Antwerp Berchem, Antwerp
Type
Office space
Office space in Antwerp Wilrijk, Antwerp
 More info
Office space in Antwerp Wilrijk, Antwerp
Office space for rent in Antwerp Wilrijk, Antwerp
Areal
110 - 941 m2
Pris pr. md.
Ca. 4,400 EUR pr md
Område
Antwerp Wilrijk, Antwerp
Type
Office space
Office space in Stad Antwerp, Antwerp
 More info
Office space in Stad Antwerp, Antwerp
Office space for rent in Stad Antwerp, Antwerp
Areal
Ca. 45 m2
Pris pr. md.
Ca. 2,300 EUR pr md
Område
Stad Antwerp, Antwerp
Type
Office space
Office space in Stad Antwerp, Antwerp
 More info
Office space in Stad Antwerp, Antwerp
Office space for rent in Stad Antwerp, Antwerp
Areal
Ca. 1,170 m2
Pris pr. md.
Ca. 31,250 EUR pr md
Område
Stad Antwerp, Antwerp
Type
Office space
Office space in Stad Antwerp, Antwerp
 More info
Office space in Stad Antwerp, Antwerp
Office space for rent in Stad Antwerp, Antwerp
Areal
Ca. 195 m2
Pris pr. md.
Ca. 2,200 EUR pr md
Område
Stad Antwerp, Antwerp
Type
Office space
Office space in Antwerp Wilrijk, Antwerp
 More info
Office space in Antwerp Wilrijk, Antwerp
Office space for rent in Antwerp Wilrijk, Antwerp
Areal
Ca. 285 m2
Pris pr. md.
Ca. 2,700 EUR pr md
Område
Antwerp Wilrijk, Antwerp
Type
Office space
Office space in Geel, Antwerp (Province)
 More info
Office space in Geel, Antwerp (Province)
Office space for rent in Geel, Antwerp (Province)
Areal
Ca. 330 m2
Pris pr. md.
Ca. 6,950 EUR pr md
Område
Geel, Antwerp (Province)
Type
Office space
Office space in Stad Antwerp, Antwerp
 More info
Office space in Stad Antwerp, Antwerp
Office space for rent in Stad Antwerp, Antwerp
Areal
130 - 782 m2
Pris pr. md.
Ca. 1,400 EUR pr md
Område
Stad Antwerp, Antwerp
Type
Office space
Office space in Lier, Antwerp (Province)
 More info
Office space in Lier, Antwerp (Province)
Office space for rent in Lier, Antwerp (Province)
Areal
Ca. 450 m2
Pris pr. md.
Ca. 50 EUR pr md
Område
Lier, Antwerp (Province)
Type
Office space
Office space in Stad Antwerp, Antwerp
 More info
Office space in Stad Antwerp, Antwerp
Office space for rent in Stad Antwerp, Antwerp
Areal
Ca. 10 m2
Pris pr. md.
Ca. 150 EUR pr md
Område
Stad Antwerp, Antwerp
Type
Office space
Selected customers
30,000 customers use Companyspace.com
30,000 customers
285,000 companies in our database
2,400 rentals annually
Companyspace.com is used by thousands of landlords, property companies, commercial real estate agents, investors and business centres seeking greater visibility, more enquiries and lower vacancy rates.


