


Industrial properties in Boom
Companyspace.com today:
New today 2,759
Updated 24h 2,761
Notifications about new companyspaces2,241
Copenhagen +11
Stockholm +4
Berlin +19
Oslo +2
Brussels +30
Vienna +41
Madrid +1
Dublin (county) +20
Warsaw +1
Latest update 11 min ago
Active ads 320,826
3 industrial properties found
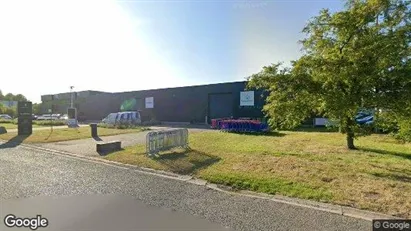
Industrial property in Boom, Antwerp (Province)
 More info
Industrial property in Boom, Antwerp (Province)
Industrial property for rent in Boom, Antwerp (Province)
Areal
-
Pris pr. md.
Not stated
Område
Boom, Antwerp (Province)
Type
Industrial property
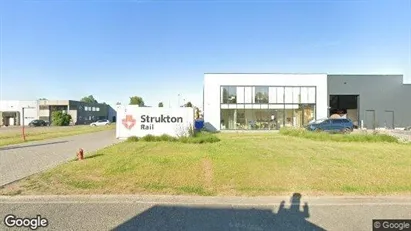
Industrial property in Boom, Antwerp (Province)
 More info
Industrial property in Boom, Antwerp (Province)
Industrial property for rent in Boom, Antwerp (Province)
Areal
-
Pris pr. md.
Not stated
Område
Boom, Antwerp (Province)
Type
Industrial property
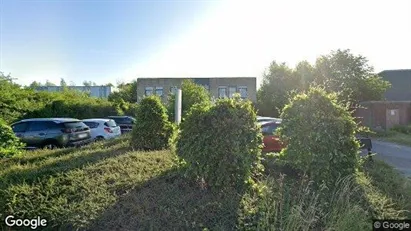
Industrial property in Boom, Antwerp (Province)
 More info
Industrial property in Boom, Antwerp (Province)
Industrial property for rent in Boom, Antwerp (Province)
Areal
-
Pris pr. md.
Not stated
Område
Boom, Antwerp (Province)
Type
Industrial property
Selected customers
30,000 customers use Companyspace.com
30,000 customers
285,000 companies in our database
2,400 rentals annually
Companyspace.com is used by thousands of landlords, property companies, commercial real estate agents, investors and business centres seeking greater visibility, more enquiries and lower vacancy rates.


