


Commercial properties in Willebroek
Companyspace.com today:
New today 4
Updated 24h 169
Copenhagen +2
Latest update 2 min ago
Active ads 366,031
34 commercial properties found
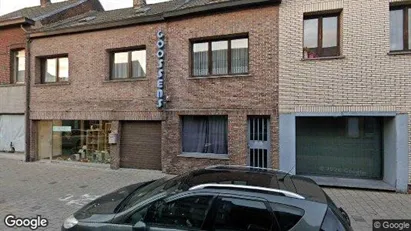
Commercial property in Willebroek, Antwerp (Province)
 More info
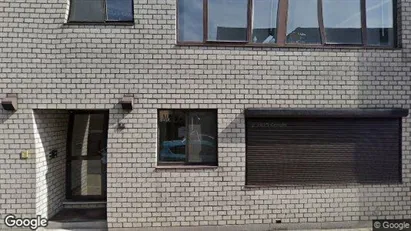
Commercial property in Willebroek, Antwerp (Province)
Commercial property for sale in Willebroek, Antwerp (Province)
Areal
Ca. 85 m2
Pris
Ca. 279,000EUR
Område
Willebroek, Antwerp (Province)
Type
Commercial property
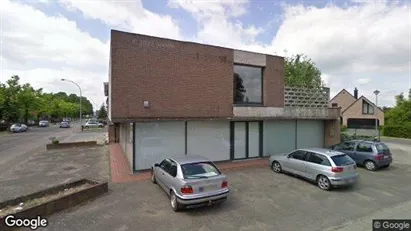
Commercial property in Willebroek, Antwerp (Province)
 More info
Commercial property in Willebroek, Antwerp (Province)
Commercial property for sale in Willebroek, Antwerp (Province)
Areal
-
Pris
Ca. 459,000EUR
Område
Willebroek, Antwerp (Province)
Type
Commercial property
Commercial property in Willebroek, Antwerp (Province)
 More info
Commercial property in Willebroek, Antwerp (Province)
Commercial property for sale in Willebroek, Antwerp (Province)
Areal
Ca. 260 m2
Pris
Ca. 289,000EUR
Område
Willebroek, Antwerp (Province)
Type
Commercial property
Commercial property in Willebroek, Antwerp (Province)
 More info
Commercial property in Willebroek, Antwerp (Province)
Commercial property for sale in Willebroek, Antwerp (Province)
Areal
Ca. 1,085 m2
Pris
Ca. 945,000EUR
Område
Willebroek, Antwerp (Province)
Type
Commercial property
Commercial property in Willebroek, Antwerp (Province)
 More info
Commercial property in Willebroek, Antwerp (Province)
Commercial property for sale in Willebroek, Antwerp (Province)
Areal
-
Pris
Ca. 258,000EUR
Område
Willebroek, Antwerp (Province)
Type
Commercial property
Commercial property in Willebroek, Antwerp (Province)
 More info
Commercial property in Willebroek, Antwerp (Province)
Commercial property for sale in Willebroek, Antwerp (Province)
Areal
Ca. 150 m2
Pris
Ca. 258,000EUR
Område
Willebroek, Antwerp (Province)
Type
Commercial property
Commercial property in Willebroek, Antwerp (Province)
 More info
Commercial property in Willebroek, Antwerp (Province)
Commercial property for sale in Willebroek, Antwerp (Province)
Areal
Ca. 90 m2
Pris
Ca. 249,000EUR
Område
Willebroek, Antwerp (Province)
Type
Commercial property
Commercial property in Willebroek, Antwerp (Province)
 More info
Commercial property in Willebroek, Antwerp (Province)
Commercial property for sale in Willebroek, Antwerp (Province)
Areal
Ca. 730 m2
Pris
Ca. 980,000EUR
Område
Willebroek, Antwerp (Province)
Type
Commercial property
Commercial property in Willebroek, Antwerp (Province)
 More info
Commercial property in Willebroek, Antwerp (Province)
Commercial property for sale in Willebroek, Antwerp (Province)
Areal
Ca. 250 m2
Pris
Ca. 426,000EUR
Område
Willebroek, Antwerp (Province)
Type
Commercial property
Commercial property in Willebroek, Antwerp (Province)
 More info
Commercial property in Willebroek, Antwerp (Province)
Commercial property for sale in Willebroek, Antwerp (Province)
Areal
Ca. 290 m2
Pris
Ca. 464,000EUR
Område
Willebroek, Antwerp (Province)
Type
Commercial property
Commercial property in Willebroek, Antwerp (Province)
 More info
Commercial property in Willebroek, Antwerp (Province)
Commercial property for sale in Willebroek, Antwerp (Province)
Areal
Ca. 760 m2
Pris
Ca. 1,294,000EUR
Område
Willebroek, Antwerp (Province)
Type
Commercial property
Commercial property in Willebroek, Antwerp (Province)
 More info
Commercial property in Willebroek, Antwerp (Province)
Commercial property for sale in Willebroek, Antwerp (Province)
Areal
Ca. 215 m2
Pris
Ca. 364,000EUR
Område
Willebroek, Antwerp (Province)
Type
Commercial property
Commercial property in Willebroek, Antwerp (Province)
 More info
Commercial property in Willebroek, Antwerp (Province)
Commercial property for sale in Willebroek, Antwerp (Province)
Areal
Ca. 610 m2
Pris
Ca. 1,138,000EUR
Område
Willebroek, Antwerp (Province)
Type
Commercial property
Commercial property in Willebroek, Antwerp (Province)
 More info
Commercial property in Willebroek, Antwerp (Province)
Commercial property for sale in Willebroek, Antwerp (Province)
Areal
Ca. 430 m2
Pris
Ca. 661,000EUR
Område
Willebroek, Antwerp (Province)
Type
Commercial property
Commercial property in Willebroek, Antwerp (Province)
 More info
Commercial property in Willebroek, Antwerp (Province)
Commercial property for sale in Willebroek, Antwerp (Province)
Areal
Ca. 490 m2
Pris
Ca. 550,000EUR
Område
Willebroek, Antwerp (Province)
Type
Commercial property
Commercial property in Willebroek, Antwerp (Province)
 More info
Commercial property in Willebroek, Antwerp (Province)
Commercial property for sale in Willebroek, Antwerp (Province)
Areal
Ca. 215 m2
Pris
Ca. 499,000EUR
Område
Willebroek, Antwerp (Province)
Type
Commercial property
Commercial property in Willebroek, Antwerp (Province)
More info
Commercial property in Willebroek, Antwerp (Province)
Commercial property for sale in Willebroek, Antwerp (Province)
Areal
-
Pris
Ca. 209,000EUR
Område
Willebroek, Antwerp (Province)
Type
Commercial property
Commercial space in Willebroek, Antwerp (Province)
More info
Commercial space in Willebroek, Antwerp (Province)
Commercial space for rent in Willebroek, Antwerp (Province)
Areal
Ca. 725 m2
Pris pr. md.
Ca. 8,000 EUR pr md
Område
Willebroek, Antwerp (Province)
Type
Commercial property
Selected customers
30,000 customers use Companyspace.com
30,000 customers
285,000 companies in our database
2,400 rentals annually
Companyspace.com is used by thousands of landlords, property companies, commercial real estate agents, investors and business centres seeking greater visibility, more enquiries and lower vacancy rates.


