


Commercial properties in Belgium
Companyspace.com today:
New today 2,893
Updated 24h 3,920
Notifications about new companyspaces1,736
Amsterdam +3
Berlin +3
Vienna +6
Paris +5
Madrid +4
Dublin (county) +23
Warsaw +19
Greater London +13
Latest update 1 min ago
Active ads 368,915
8,332 commercial properties found
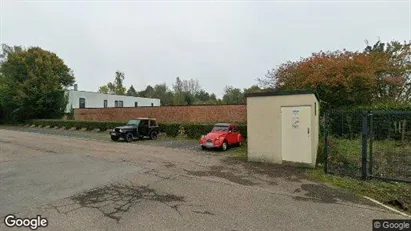
Commercial property in Grâce-Hollogne, Luik (region)
 More info
Commercial property in Grâce-Hollogne, Luik (region)
Commercial property for sale in Grâce-Hollogne, Luik (region)
Areal
Ca. 730 m2
Pris
Not stated
Område
Grâce-Hollogne, Luik (region)
Type
Commercial property
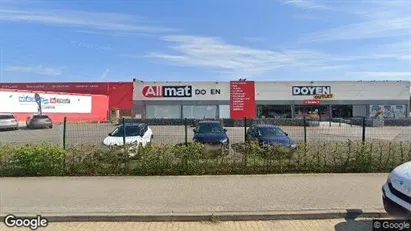
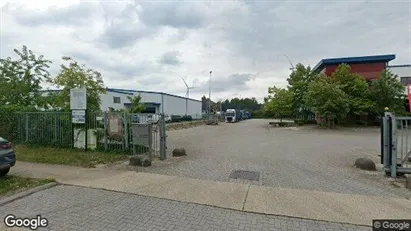
Commercial space in Laakdal, Antwerp (Province)
 More info
Commercial space in Laakdal, Antwerp (Province)
Commercial space for rent in Laakdal, Antwerp (Province)
Areal
Ca. 15,380 m2
Pris pr. md.
Not stated
Område
Laakdal, Antwerp (Province)
Type
Commercial property
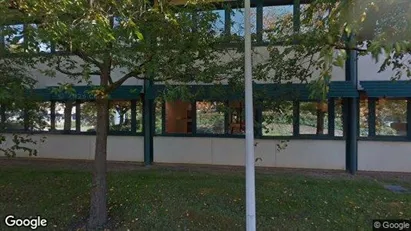
Commercial space in Machelen, Vlaams-Brabant
 More info
Commercial space in Machelen, Vlaams-Brabant
Commercial space for rent in Machelen, Vlaams-Brabant
Areal
-
Pris pr. md.
Not stated
Område
Machelen, Vlaams-Brabant
Type
Commercial property
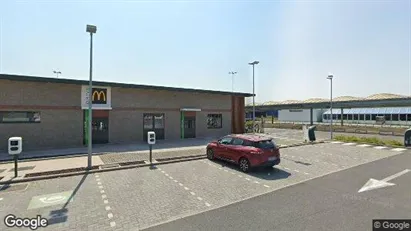
Commercial space in Kuurne, West-Vlaanderen
 More info
Commercial space in Kuurne, West-Vlaanderen
Commercial space for rent in Kuurne, West-Vlaanderen
Areal
Ca. 3,110 m2
Pris pr. md.
Not stated
Område
Kuurne, West-Vlaanderen
Type
Commercial property
Commercial space in Incourt, Waals-Brabant
 More info
Commercial space in Incourt, Waals-Brabant
Commercial space for rent in Incourt, Waals-Brabant
Areal
Ca. 200 m2
Pris pr. md.
Not stated
Område
Incourt, Waals-Brabant
Type
Commercial property
Commercial space in Bergen, Henegouwen
 More info
Commercial space in Bergen, Henegouwen
Commercial space for rent in Bergen, Henegouwen
Areal
Ca. 155 m2
Pris pr. md.
Not stated
Område
Bergen, Henegouwen
Type
Commercial property
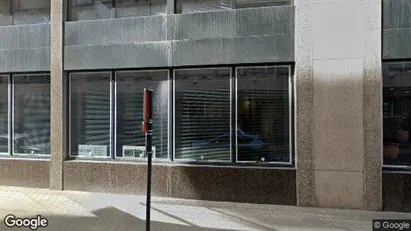
Commercial space in Stad Brussel, Brussels
 More info
Commercial space in Stad Brussel, Brussels
Commercial space for rent in Stad Brussel, Brussels
Areal
Ca. 745 m2
Pris pr. md.
Not stated
Område
Stad Brussel, Brussels
Type
Commercial property
Commercial space in Hasselt, Limburg
 More info
Commercial space in Hasselt, Limburg
Commercial space for rent in Hasselt, Limburg
Areal
Ca. 160 m2
Pris pr. md.
Not stated
Område
Hasselt, Limburg
Type
Commercial property
Commercial space in Harelbeke, West-Vlaanderen
 More info
Commercial space in Harelbeke, West-Vlaanderen
Commercial space for rent in Harelbeke, West-Vlaanderen
Areal
Ca. 315 m2
Pris pr. md.
Not stated
Område
Harelbeke, West-Vlaanderen
Type
Commercial property
Commercial space in Edegem, Antwerp (Province)
 More info
Commercial space in Edegem, Antwerp (Province)
Commercial space for rent in Edegem, Antwerp (Province)
Areal
Ca. 920 m2
Pris pr. md.
Not stated
Område
Edegem, Antwerp (Province)
Type
Commercial property
Commercial property in Seraing, Luik (region)
 More info
Commercial property in Seraing, Luik (region)
Commercial property for sale in Seraing, Luik (region)
Areal
-
Pris
Not stated
Område
Seraing, Luik (region)
Type
Commercial property
Commercial space in Luik, Luik (region)
 More info
Commercial space in Luik, Luik (region)
Commercial space for rent in Luik, Luik (region)
Areal
Ca. 265 m2
Pris pr. md.
Not stated
Område
Luik, Luik (region)
Type
Commercial property
Commercial space in Nazareth, Oost-Vlaanderen
 More info
Commercial space in Nazareth, Oost-Vlaanderen
Commercial space for rent in Nazareth, Oost-Vlaanderen
Areal
-
Pris pr. md.
Not stated
Område
Nazareth, Oost-Vlaanderen
Type
Commercial property
Commercial space in Genk, Limburg
 More info
Commercial space in Genk, Limburg
Commercial space for rent in Genk, Limburg
Areal
Ca. 2,540 m2
Pris pr. md.
Not stated
Område
Genk, Limburg
Type
Commercial property
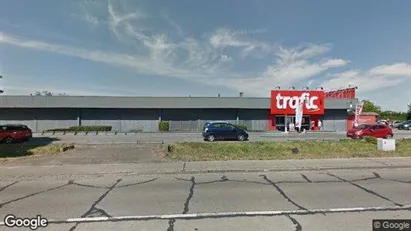
Commercial space in Kuurne, West-Vlaanderen
 More info
Commercial space in Kuurne, West-Vlaanderen
Commercial space for rent in Kuurne, West-Vlaanderen
Areal
Ca. 6,120 m2
Pris pr. md.
Not stated
Område
Kuurne, West-Vlaanderen
Type
Commercial property
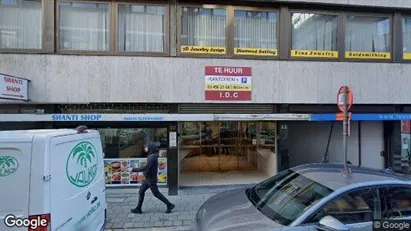
Commercial space in Stad Brussel, Brussels
 More info
Commercial space in Stad Brussel, Brussels
Commercial space for rent in Stad Brussel, Brussels
Areal
Ca. 200 m2
Pris pr. md.
Not stated
Område
Stad Brussel, Brussels
Type
Commercial property
Commercial property in Stad Antwerp, Antwerp
 More info
Commercial property in Stad Antwerp, Antwerp
Commercial property for sale in Stad Antwerp, Antwerp
Areal
Ca. 280 m2
Pris
Not stated
Område
Stad Antwerp, Antwerp
Type
Commercial property
Commercial space in Binche, Henegouwen
 More info
Commercial space in Binche, Henegouwen
Commercial space for rent in Binche, Henegouwen
Areal
Ca. 1,000 m2
Pris pr. md.
Not stated
Område
Binche, Henegouwen
Type
Commercial property
Selected customers
30,000 customers use Companyspace.com
30,000 customers
285,000 companies in our database
2,400 rentals annually
Companyspace.com is used by thousands of landlords, property companies, commercial real estate agents, investors and business centres seeking greater visibility, more enquiries and lower vacancy rates.


