


Commercial properties in Belgium
Companyspace.com today:
New today 336
Updated 24h 1,124
Notifications about new companyspaces61
Amsterdam +2
Brussels +4
Vienna +13
Latest update 1 min ago
Active ads 365,617
8,210 commercial properties found
Commercial space in Stad Gent, Gent
 More info
Commercial space in Stad Gent, Gent
Commercial space for rent in Stad Gent, Gent
Areal
Ca. 540 m2
Pris pr. md.
Ca. 9,000 EUR per month
Område
Stad Gent, Gent
Type
Commercial property
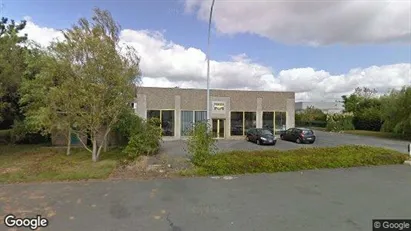
Commercial space in Diepenbeek, Limburg
 More info
Commercial space in Diepenbeek, Limburg
Commercial space for rent in Diepenbeek, Limburg
Areal
Ca. 595 m2
Pris pr. md.
Ca. 2,200 EUR per month
Område
Diepenbeek, Limburg
Type
Commercial property
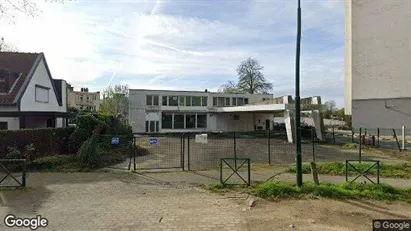
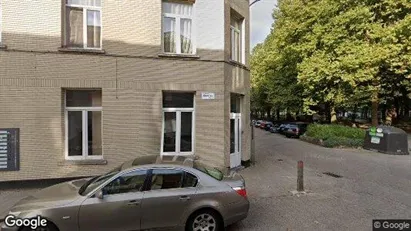
Commercial property in Brussels Vorst, Brussels
 More info
Commercial property in Brussels Vorst, Brussels
Commercial property for sale in Brussels Vorst, Brussels
Areal
Ca. 800 m2
Pris
Ca. 2,200,000EUR
Område
Brussels Vorst, Brussels
Type
Commercial property
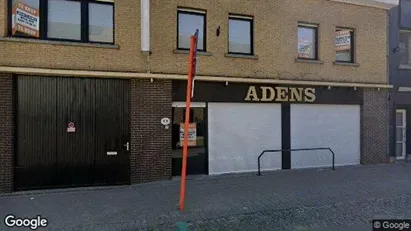
Commercial property in Deerlijk, West-Vlaanderen
 More info
Commercial property in Deerlijk, West-Vlaanderen
Commercial property for sale in Deerlijk, West-Vlaanderen
Areal
Ca. 605 m2
Pris
Ca. 499,000EUR
Område
Deerlijk, West-Vlaanderen
Type
Commercial property
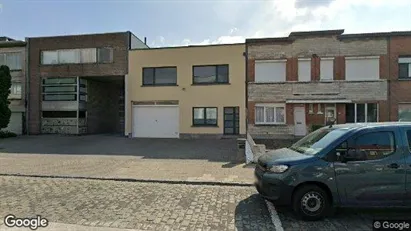
Commercial space in Roeselare, West-Vlaanderen
 More info
Commercial space in Roeselare, West-Vlaanderen
Commercial space for rent in Roeselare, West-Vlaanderen
Areal
-
Pris pr. md.
Ca. 3,000 EUR per month
Område
Roeselare, West-Vlaanderen
Type
Commercial property
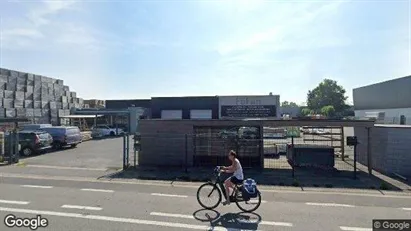
Commercial space in Destelbergen, Oost-Vlaanderen
 More info
Commercial space in Destelbergen, Oost-Vlaanderen
Commercial space for rent in Destelbergen, Oost-Vlaanderen
Areal
Ca. 540 m2
Pris pr. md.
Ca. 6,450 EUR per month
Område
Destelbergen, Oost-Vlaanderen
Type
Commercial property
Commercial property in Lier, Antwerp (Province)
 More info
Commercial property in Lier, Antwerp (Province)
Commercial property for sale in Lier, Antwerp (Province)
Areal
Ca. 230 m2
Pris
Ca. 699,000EUR
Område
Lier, Antwerp (Province)
Type
Commercial property
Commercial space in Stad Gent, Gent
 More info
Commercial space in Stad Gent, Gent
Commercial space for rent in Stad Gent, Gent
Areal
-
Pris pr. md.
Ca. 1,350 EUR per month
Område
Stad Gent, Gent
Type
Commercial property
Commercial space in Ardooie, West-Vlaanderen
 More info
Commercial space in Ardooie, West-Vlaanderen
Commercial space for rent in Ardooie, West-Vlaanderen
Areal
Ca. 540 m2
Pris pr. md.
Ca. 7,700 EUR per month
Område
Ardooie, West-Vlaanderen
Type
Commercial property
Commercial space in Lendelede, West-Vlaanderen
 More info
Commercial space in Lendelede, West-Vlaanderen
Commercial space for rent in Lendelede, West-Vlaanderen
Areal
Ca. 140 m2
Pris pr. md.
Ca. 750 EUR per month
Område
Lendelede, West-Vlaanderen
Type
Commercial property
Commercial property in Zwijndrecht, Antwerp (Province)
 More info
Commercial property in Zwijndrecht, Antwerp (Province)
Commercial property for sale in Zwijndrecht, Antwerp (Province)
Areal
Ca. 105 m2
Pris
Ca. 188,000EUR
Område
Zwijndrecht, Antwerp (Province)
Type
Commercial property
Commercial space in Hooglede, West-Vlaanderen
 More info
Commercial space in Hooglede, West-Vlaanderen
Commercial space for rent in Hooglede, West-Vlaanderen
Areal
Ca. 595 m2
Pris pr. md.
Ca. 1,700 EUR per month
Område
Hooglede, West-Vlaanderen
Type
Commercial property
Commercial space in Roeselare, West-Vlaanderen
 More info
Commercial space in Roeselare, West-Vlaanderen
Commercial space for rent in Roeselare, West-Vlaanderen
Areal
Ca. 595 m2
Pris pr. md.
Ca. 1,750 EUR per month
Område
Roeselare, West-Vlaanderen
Type
Commercial property
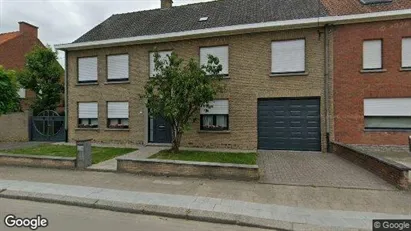
Commercial property in Ledegem, West-Vlaanderen
 More info
Commercial property in Ledegem, West-Vlaanderen
Commercial property for sale in Ledegem, West-Vlaanderen
Areal
Ca. 355 m2
Pris
Ca. 399,000EUR
Område
Ledegem, West-Vlaanderen
Type
Commercial property
Commercial property in Nieuwpoort, West-Vlaanderen
 More info
Commercial property in Nieuwpoort, West-Vlaanderen
Commercial property for sale in Nieuwpoort, West-Vlaanderen
Areal
-
Pris
Ca. 388,000EUR
Område
Nieuwpoort, West-Vlaanderen
Type
Commercial property
Commercial property in Ichtegem, West-Vlaanderen
 More info
Commercial property in Ichtegem, West-Vlaanderen
Commercial property for sale in Ichtegem, West-Vlaanderen
Areal
-
Pris
Ca. 1,050,000EUR
Område
Ichtegem, West-Vlaanderen
Type
Commercial property
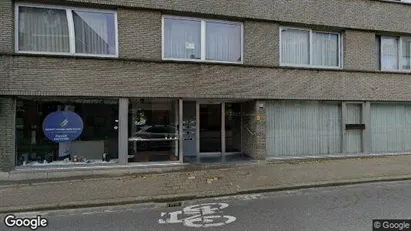
Commercial space in Stad Antwerp, Antwerp
 More info
Commercial space in Stad Antwerp, Antwerp
Commercial space for rent in Stad Antwerp, Antwerp
Areal
-
Pris pr. md.
Ca. 900 EUR per month
Område
Stad Antwerp, Antwerp
Type
Commercial property
Commercial space in Middelkerke, West-Vlaanderen
 More info
Commercial space in Middelkerke, West-Vlaanderen
Commercial space for rent in Middelkerke, West-Vlaanderen
Areal
-
Pris pr. md.
Ca. 1,600 EUR per month
Område
Middelkerke, West-Vlaanderen
Type
Commercial property
Selected customers
Selected customers
30,000 customers use Companyspace.com
30,000 customers
285,000 companies in our database
2,400 rentals annually
Companyspace.com is used by thousands of landlords, property companies, commercial real estate agents, investors and business centres seeking greater visibility, more enquiries and lower vacancy rates.


