


Commercial properties in Belgium
Companyspace.com today:
New today 400
Updated 24h 929
Notifications about new companyspaces72
Copenhagen +6
Amsterdam +15
Berlin +1
Brussels +4
Warsaw +14
Lisbon +1
Latest update 1 min ago
Active ads 365,460
8,087 commercial properties found
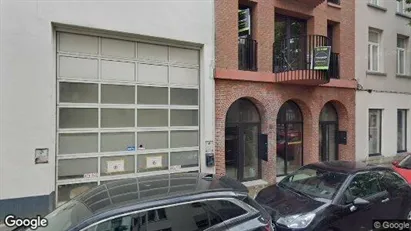
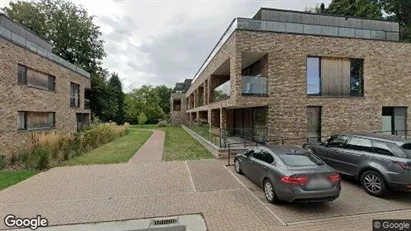
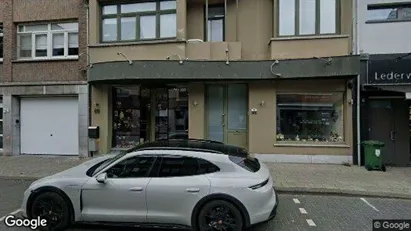
Commercial space in Stad Antwerp, Antwerp
 More info
Commercial space in Stad Antwerp, Antwerp
Commercial space for rent in Stad Antwerp, Antwerp
Areal
Ca. 75 m2
Pris pr. md.
Ca. 1,900 EUR pr md
Område
Stad Antwerp, Antwerp
Type
Commercial property
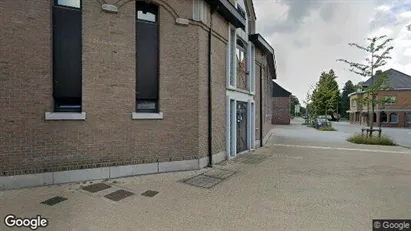
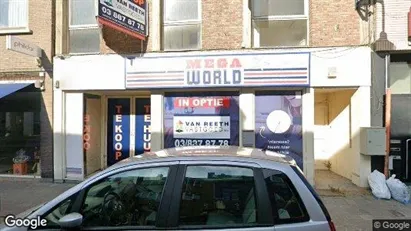
Commercial space in Genk, Limburg
 More info
Commercial space in Genk, Limburg
Commercial space for rent in Genk, Limburg
Areal
Ca. 105 m2
Pris pr. md.
Ca. 1,500 EUR pr md
Område
Genk, Limburg
Type
Commercial property
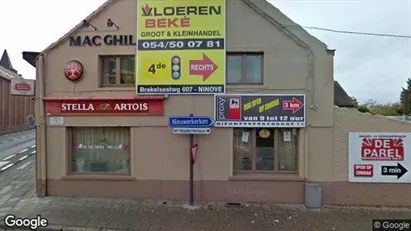
Commercial property in Hasselt, Limburg
 More info
Commercial property in Hasselt, Limburg
Commercial property for sale in Hasselt, Limburg
Areal
-
Pris
Ca. 300,000EUR
Område
Hasselt, Limburg
Type
Commercial property
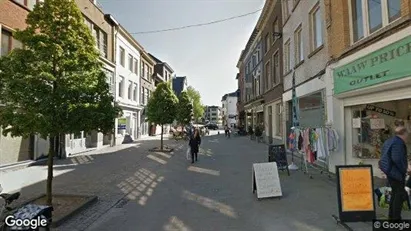
Commercial space in Kasterlee, Antwerp (Province)
 More info
Commercial space in Kasterlee, Antwerp (Province)
Commercial space for rent in Kasterlee, Antwerp (Province)
Areal
Ca. 145 m2
Pris pr. md.
Ca. 1,250 EUR pr md
Område
Kasterlee, Antwerp (Province)
Type
Commercial property
Commercial property in Erpe-Mere, Oost-Vlaanderen
 More info
Commercial property in Erpe-Mere, Oost-Vlaanderen
Commercial property for sale in Erpe-Mere, Oost-Vlaanderen
Areal
-
Pris
Ca. 645,000EUR
Område
Erpe-Mere, Oost-Vlaanderen
Type
Commercial property
Commercial property in Geraardsbergen, Oost-Vlaanderen
 More info
Commercial property in Geraardsbergen, Oost-Vlaanderen
Commercial property for sale in Geraardsbergen, Oost-Vlaanderen
Areal
-
Pris
Ca. 345,000EUR
Område
Geraardsbergen, Oost-Vlaanderen
Type
Commercial property
Commercial property in Brussels Sint-Joost-ten-Node, Brussels
 More info
Commercial property in Brussels Sint-Joost-ten-Node, Brussels
Commercial property for sale in Brussels Sint-Joost-ten-Node, Brussels
Areal
Ca. 315 m2
Pris
Ca. 525,000EUR
Område
Brussels Sint-Joost-ten-Node, Brussels
Type
Commercial property
Commercial space in Oudenaarde, Oost-Vlaanderen
 More info
Commercial space in Oudenaarde, Oost-Vlaanderen
Commercial space for rent in Oudenaarde, Oost-Vlaanderen
Areal
-
Pris pr. md.
Ca. 1,500 EUR pr md
Område
Oudenaarde, Oost-Vlaanderen
Type
Commercial property
Commercial space in Aalst, Oost-Vlaanderen
 More info
Commercial space in Aalst, Oost-Vlaanderen
Commercial space te huur in Aalst, Oost-Vlaanderen
Areal
Ca. 60 m2
Pris pr. md.
Ca. 1,000 EUR pr md
Område
Aalst, Oost-Vlaanderen
Type
Commercial property
Commercial property in Kontich, Antwerp (Province)
 More info
Commercial property in Kontich, Antwerp (Province)
Commercial property te koop in Kontich, Antwerp (Province)
Areal
Ca. 825 m2
Pris
Ca. 449,000EUR
Område
Kontich, Antwerp (Province)
Type
Commercial property
Commercial space in Aalst, Oost-Vlaanderen
 More info
Commercial space in Aalst, Oost-Vlaanderen
Commercial space te huur in Aalst, Oost-Vlaanderen
Areal
Ca. 60 m2
Pris pr. md.
Ca. 950 EUR pr md
Område
Aalst, Oost-Vlaanderen
Type
Commercial property
Commercial property in Bergen, Henegouwen
 More info
Commercial property in Bergen, Henegouwen
Commercial property for sale in Bergen, Henegouwen
Areal
Ca. 745 m2
Pris
Ca. 55,000EUR
Område
Bergen, Henegouwen
Type
Commercial property
Commercial space in Aalst, Oost-Vlaanderen
 More info
Commercial space in Aalst, Oost-Vlaanderen
Commercial space for rent in Aalst, Oost-Vlaanderen
Areal
-
Pris pr. md.
Ca. 1,000 EUR pr md
Område
Aalst, Oost-Vlaanderen
Type
Commercial property
Commercial property in Aartselaar, Antwerp (Province)
 More info
Commercial property in Aartselaar, Antwerp (Province)
Commercial property te koop in Aartselaar, Antwerp (Province)
Areal
Ca. 85 m2
Pris
Ca. 225,000EUR
Område
Aartselaar, Antwerp (Province)
Type
Commercial property
Commercial space in Turnhout, Antwerp (Province)
 More info
Commercial space in Turnhout, Antwerp (Province)
Commercial space for rent in Turnhout, Antwerp (Province)
Areal
Ca. 95 m2
Pris pr. md.
Ca. 900 EUR pr md
Område
Turnhout, Antwerp (Province)
Type
Commercial property
Commercial property in Bilzen, Limburg
 More info
Commercial property in Bilzen, Limburg
Commercial property for sale in Bilzen, Limburg
Areal
Ca. 5 m2
Pris
Ca. 625,000EUR
Område
Bilzen, Limburg
Type
Commercial property
Commercial property in Brussels Jette, Brussels
 More info
Commercial property in Brussels Jette, Brussels
Commercial property for sale in Brussels Jette, Brussels
Areal
Ca. 90 m2
Pris
Ca. 175,000EUR
Område
Brussels Jette, Brussels
Type
Commercial property
Commercial space in Aalst, Oost-Vlaanderen
 More info
Commercial space in Aalst, Oost-Vlaanderen
Commercial space te huur in Aalst, Oost-Vlaanderen
Areal
Ca. 60 m2
Pris pr. md.
Ca. 950 EUR pr md
Område
Aalst, Oost-Vlaanderen
Type
Commercial property
Selected customers
30,000 customers use Companyspace.com
30,000 customers
285,000 companies in our database
2,400 rentals annually
Companyspace.com is used by thousands of landlords, property companies, commercial real estate agents, investors and business centres seeking greater visibility, more enquiries and lower vacancy rates.


