


Commercial properties in Belgium
Companyspace.com today:
Updated 24h 1,197
Notifications about new companyspaces136
Latest update 2 h ago
Active ads 365,302
8,084 commercial properties found
Commercial property in Brugge, West-Vlaanderen
 More info
Commercial property in Brugge, West-Vlaanderen
Commercial property for sale in Brugge, West-Vlaanderen
Areal
Ca. 55 m2
Pris
Ca. 55,000EUR
Område
Brugge, West-Vlaanderen
Type
Commercial property
Commercial property in Sint-Truiden, Limburg
 More info
Commercial property in Sint-Truiden, Limburg
Commercial property for sale in Sint-Truiden, Limburg
Areal
Ca. 230 m2
Pris
Ca. 510,000EUR
Område
Sint-Truiden, Limburg
Type
Commercial property
Commercial property in Willebroek, Antwerp (Province)
 More info
Commercial property in Willebroek, Antwerp (Province)
Commercial property for sale in Willebroek, Antwerp (Province)
Areal
-
Pris
Ca. 459,000EUR
Område
Willebroek, Antwerp (Province)
Type
Commercial property
Commercial property in Lier, Antwerp (Province)
 More info
Commercial property in Lier, Antwerp (Province)
Commercial property for sale in Lier, Antwerp (Province)
Areal
-
Pris
Ca. 895,000EUR
Område
Lier, Antwerp (Province)
Type
Commercial property
Commercial property in Hasselt, Limburg
 More info
Commercial property in Hasselt, Limburg
Commercial property for sale in Hasselt, Limburg
Areal
-
Pris
Ca. 890,000EUR
Område
Hasselt, Limburg
Type
Commercial property
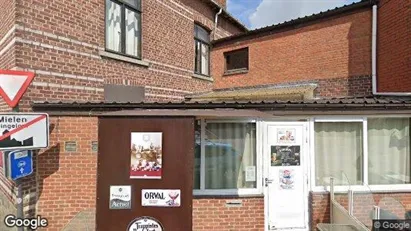
Commercial property in Gingelom, Limburg
 More info
Commercial property in Gingelom, Limburg
Commercial property for sale in Gingelom, Limburg
Areal
Ca. 335 m2
Pris
Ca. 165,000EUR
Område
Gingelom, Limburg
Type
Commercial property
Commercial property in Geraardsbergen, Oost-Vlaanderen
 More info
Commercial property in Geraardsbergen, Oost-Vlaanderen
Commercial property for sale in Geraardsbergen, Oost-Vlaanderen
Areal
-
Pris
Ca. 225,000EUR
Område
Geraardsbergen, Oost-Vlaanderen
Type
Commercial property
Commercial property in Aalter, Oost-Vlaanderen
 More info
Commercial property in Aalter, Oost-Vlaanderen
Commercial property for sale in Aalter, Oost-Vlaanderen
Areal
Ca. 4,500 m2
Pris
Ca. 4,235,000EUR
Område
Aalter, Oost-Vlaanderen
Type
Commercial property
Commercial property in Genk, Limburg
 More info
Commercial property in Genk, Limburg
Commercial property for sale in Genk, Limburg
Areal
Ca. 95 m2
Pris
Ca. 89,000EUR
Område
Genk, Limburg
Type
Commercial property
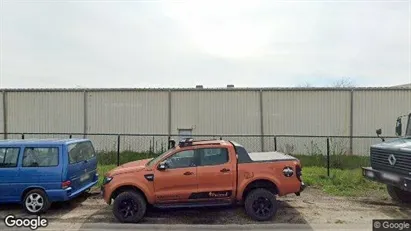
Commercial property in Tessenderlo, Limburg
 More info
Commercial property in Tessenderlo, Limburg
Commercial property for sale in Tessenderlo, Limburg
Areal
Ca. 500 m2
Pris
Ca. 845,000EUR
Område
Tessenderlo, Limburg
Type
Commercial property
Commercial property in Essen, Antwerp (Province)
 More info
Commercial property in Essen, Antwerp (Province)
Commercial property for sale in Essen, Antwerp (Province)
Areal
Ca. 240 m2
Pris
Ca. 390,000EUR
Område
Essen, Antwerp (Province)
Type
Commercial property
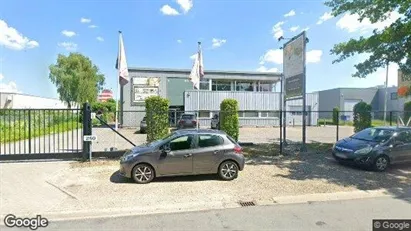
Commercial property in Genk, Limburg
 More info
Commercial property in Genk, Limburg
Commercial property for sale in Genk, Limburg
Areal
Ca. 1,780 m2
Pris
Ca. 1,499,000EUR
Område
Genk, Limburg
Type
Commercial property
Commercial property in Deerlijk, West-Vlaanderen
 More info
Commercial property in Deerlijk, West-Vlaanderen
Commercial property for sale in Deerlijk, West-Vlaanderen
Areal
Ca. 130 m2
Pris
Ca. 289,000EUR
Område
Deerlijk, West-Vlaanderen
Type
Commercial property
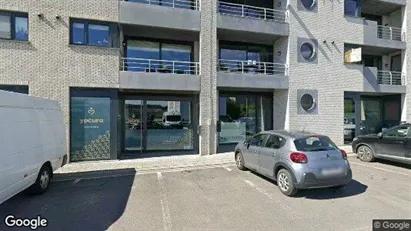
Commercial property in Oostkamp, West-Vlaanderen
 More info
Commercial property in Oostkamp, West-Vlaanderen
Commercial property for sale in Oostkamp, West-Vlaanderen
Areal
-
Pris
Ca. 375,000EUR
Område
Oostkamp, West-Vlaanderen
Type
Commercial property
Commercial property in Zonhoven, Limburg
 More info
Commercial property in Zonhoven, Limburg
Commercial property for sale in Zonhoven, Limburg
Areal
Ca. 1,450 m2
Pris
Ca. 2,200,000EUR
Område
Zonhoven, Limburg
Type
Commercial property
Commercial property in Geraardsbergen, Oost-Vlaanderen
 More info
Commercial property in Geraardsbergen, Oost-Vlaanderen
Commercial property for sale in Geraardsbergen, Oost-Vlaanderen
Areal
-
Pris
Ca. 325,000EUR
Område
Geraardsbergen, Oost-Vlaanderen
Type
Commercial property
Commercial property in Antwerp Merksem, Antwerp
 More info
Commercial property in Antwerp Merksem, Antwerp
Commercial property for sale in Antwerp Merksem, Antwerp
Areal
-
Pris
Ca. 204,000EUR
Område
Antwerp Merksem, Antwerp
Type
Commercial property
Commercial property in Ieper, West-Vlaanderen
 More info
Commercial property in Ieper, West-Vlaanderen
Commercial property for sale in Ieper, West-Vlaanderen
Areal
Ca. 75 m2
Pris
Ca. 189,000EUR
Område
Ieper, West-Vlaanderen
Type
Commercial property
Selected customers
30,000 customers use Companyspace.com
30,000 customers
285,000 companies in our database
2,400 rentals annually
Companyspace.com is used by thousands of landlords, property companies, commercial real estate agents, investors and business centres seeking greater visibility, more enquiries and lower vacancy rates.


