


Shops in Europe
Companyspace.com today:
New today 1,755
Updated 24h 1,755
Notifications about new companyspaces1,798
Copenhagen +4
Stockholm +2
Amsterdam +10
Berlin +11
Brussels +5
Vienna +66
Paris +11
Madrid +1
Dublin (county) +7
Warsaw +18
Roma (region) +3
Lisbon +1
Greater London +4
Latest update 1 min ago
Active ads 366,476
38,853 shops found
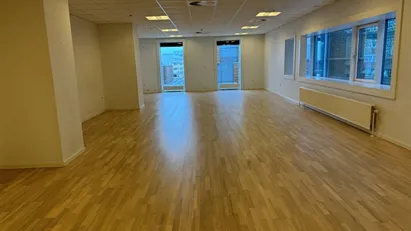
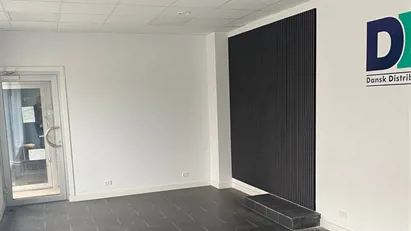
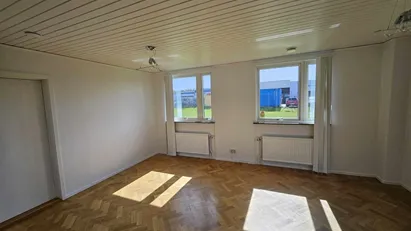
Office space in Vejle, Vejle (region)
 More info
Office space in Vejle, Vejle (region)
Office space for rent in Vejle, Vejle (region)
Areal
150 - 498 m2
Pris pr. md.
Ca. 29,800 DKK pr md
Område
Vejle, Vejle (region)
Type
Office space
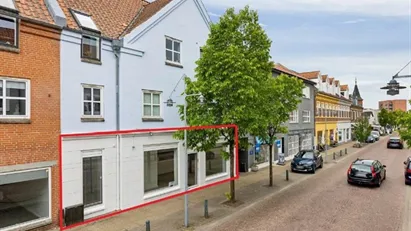
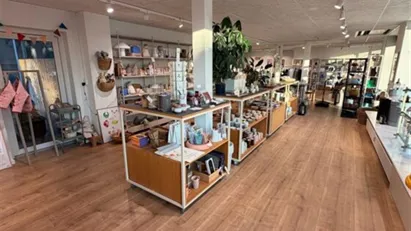
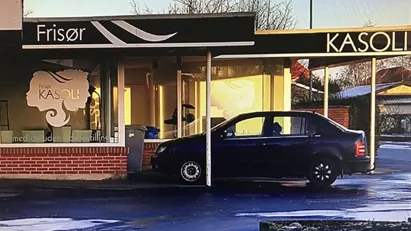
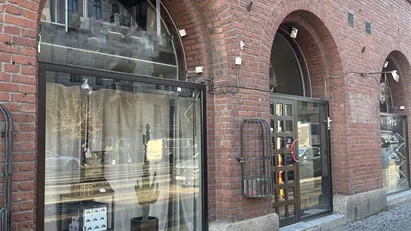
Shop in Brønderslev, North Jutland Region
 More info
Shop in Brønderslev, North Jutland Region
Shop for rent in Brønderslev, North Jutland Region
Areal
Ca. 100 m2
Pris pr. md.
Ca. 8,350 DKK pr md
Område
Brønderslev, North Jutland Region
Type
Shop
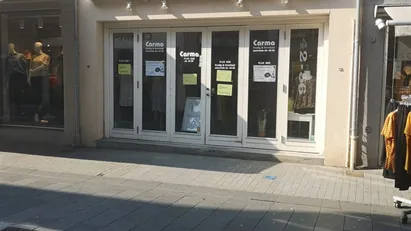
Shop in Nykøbing Falster, Region Zealand
 More info
Shop in Nykøbing Falster, Region Zealand
Shop for rent in Nykøbing Falster, Region Zealand
Areal
Ca. 120 m2
Pris pr. md.
Ca. 14,150 DKK pr md
Område
Nykøbing Falster, Region Zealand
Type
Shop
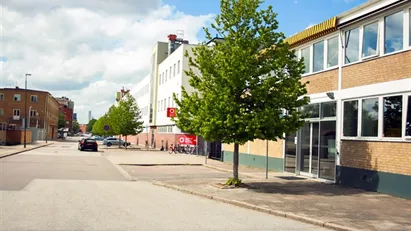
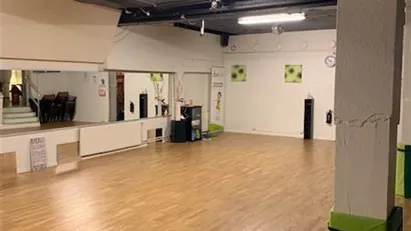
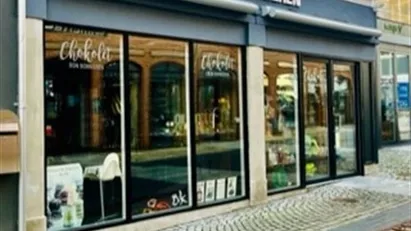
Shop in Malmö City, Malmö
 More info
Shop in Malmö City, Malmö
Shop for rent in Malmö City, Malmö
Areal
200 - 1,500 m2
Pris pr. md.
Ca. 250,000 SEK pr md
Område
Malmö City, Malmö
Type
Shop
Restaurant in Kolding, Region of Southern Denmark
 More info
Restaurant in Kolding, Region of Southern Denmark
Restaurant for rent in Kolding, Region of Southern Denmark
Areal
Ca. 180 m2
Pris pr. md.
Ca. 34,950 DKK pr md
Område
Kolding, Region of Southern Denmark
Type
Restaurant
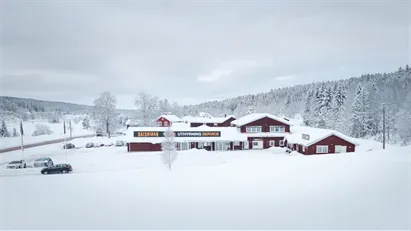
Shop in Malung-Sälen, Dalarna
 More info
Shop in Malung-Sälen, Dalarna
Shop for rent in Malung-Sälen, Dalarna
Areal
Ca. 135 m2
Pris pr. md.
Ca. 16,650 SEK pr md
Område
Malung-Sälen, Dalarna
Type
Shop
Shop in Aalborg, Aalborg (region)
 More info
Shop in Aalborg, Aalborg (region)
Shop for rent in Aalborg, Aalborg (region)
Areal
Ca. 150 m2
Pris pr. md.
Ca. 22,900 DKK pr md
Område
Aalborg, Aalborg (region)
Type
Shop
Shop in Lynge, North Zealand
 More info
Shop in Lynge, North Zealand
Shop for rent in Lynge, North Zealand
Areal
Ca. 75 m2
Pris pr. md.
Ca. 15,500 DKK pr md
Område
Lynge, North Zealand
Type
Shop
Shop in Randers C, Randers
 More info
Shop in Randers C, Randers
Shop for rent in Randers C, Randers
Areal
Ca. 70 m2
Pris pr. md.
Ca. 5,000 DKK pr md
Område
Randers C, Randers
Type
Shop
Shop in Köping, Västmanland County
 More info
Shop in Köping, Västmanland County
Shop for rent in Köping, Västmanland County
Areal
Ca. 250 m2
Pris pr. md.
Ca. 15,000 SEK pr md
Område
Köping, Västmanland County
Type
Shop
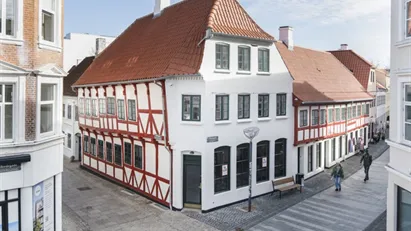
Shop in Aabenraa, Region of Southern Denmark
 More info
Shop in Aabenraa, Region of Southern Denmark
Shop for rent in Aabenraa, Region of Southern Denmark
Areal
Ca. 245 m2
Pris pr. md.
Ca. 9,500 DKK pr md
Område
Aabenraa, Region of Southern Denmark
Type
Shop
Office space in Nybro, Kalmar County
 More info
Office space in Nybro, Kalmar County
Office space for rent in Nybro, Kalmar County
Areal
100 - 210 m2
Pris pr. md.
Ca. 8,750 SEK pr md
Område
Nybro, Kalmar County
Type
Office space
Shop in Gothenburg City Centre, Gothenburg
 More info
Shop in Gothenburg City Centre, Gothenburg
Shop for rent in Gothenburg City Centre, Gothenburg
Areal
40 - 115 m2
Pris pr. md.
Ca. 45,000 SEK pr md
Område
Gothenburg City Centre, Gothenburg
Type
Shop
Shop in Nyborg, Funen
 More info
Shop in Nyborg, Funen
Shop for rent in Nyborg, Funen
Areal
Ca. 230 m2
Pris pr. md.
Ca. 13,650 DKK pr md
Område
Nyborg, Funen
Type
Shop
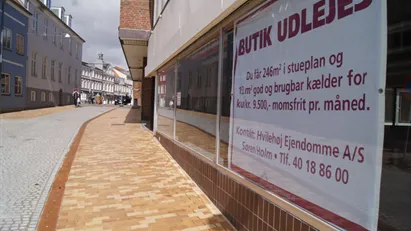
Shop in Vanløse, Copenhagen
 More info
Shop in Vanløse, Copenhagen
Shop for rent in Vanløse, Copenhagen
Areal
Ca. 110 m2
Pris pr. md.
Not stated
Område
Vanløse, Copenhagen
Type
Shop
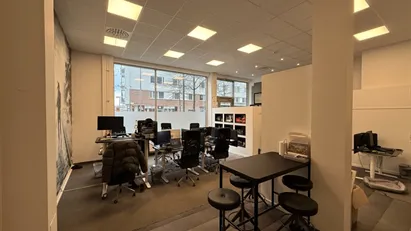
Office space in Södermalm, Stockholm
 More info
Office space in Södermalm, Stockholm
Office space for rent in Södermalm, Stockholm
Areal
Ca. 100 m2
Pris pr. md.
Ca. 34,250 SEK pr md
Område
Södermalm, Stockholm
Type
Office space
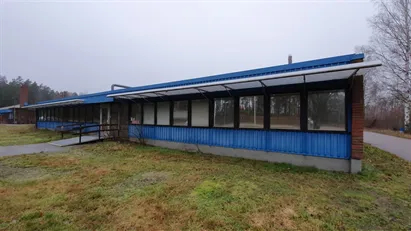
Shop in Skive, Central Jutland Region
 More info
Shop in Skive, Central Jutland Region
Shop for rent in Skive, Central Jutland Region
Areal
Ca. 135 m2
Pris pr. md.
Ca. 14,600 DKK pr md
Område
Skive, Central Jutland Region
Type
Shop
Office space in Stenungsund, Västra Götaland County
 More info
Office space in Stenungsund, Västra Götaland County
Office space for rent in Stenungsund, Västra Götaland County
Areal
8 - 60 m2
Pris pr. md.
Not stated
Område
Stenungsund, Västra Götaland County
Type
Office space
Selected customers
30,000 customers use Companyspace.com
30,000 customers
285,000 companies in our database
2,400 rentals annually
Companyspace.com is used by thousands of landlords, property companies, commercial real estate agents, investors and business centres seeking greater visibility, more enquiries and lower vacancy rates.


