


Office spaces in Europe
Companyspace.com today:
New today 1,703
Updated 24h 1,703
Notifications about new companyspaces1,798
Copenhagen +4
Stockholm +2
Amsterdam +9
Berlin +11
Brussels +5
Vienna +66
Paris +11
Madrid +1
Dublin (county) +7
Warsaw +19
Roma (region) +3
Lisbon +1
Greater London +4
Latest update 1 min ago
Active ads 366,484
144,046 office spaces found
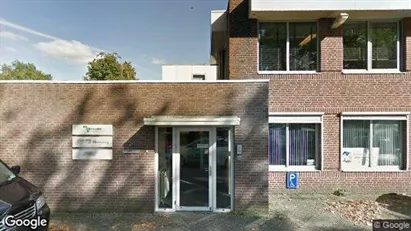
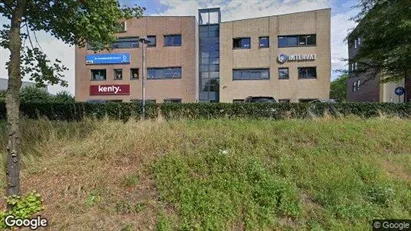
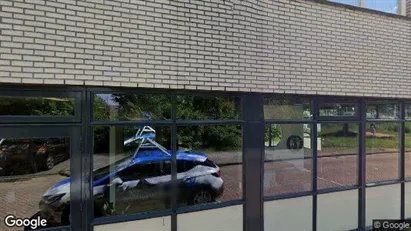
Office space in Oisterwijk, North Brabant
 More info
Office space in Oisterwijk, North Brabant
Office space for rent in Oisterwijk, North Brabant
Areal
Ca. 30 m2
Pris pr. md.
Ca. 600 EUR pr md
Område
Oisterwijk, North Brabant
Type
Office space
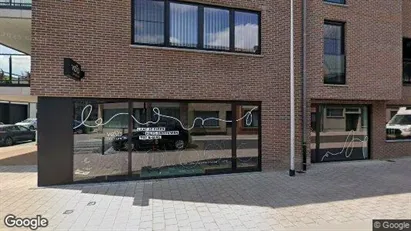
Office space in Zutphen, Gelderland
 More info
Office space in Zutphen, Gelderland
Hoogwaardig afgewerkte kantoorruimten te huur in een mooie aanloopstraat naar binnenstad Zutphen!
Gelegen aan de Spittaalstraat 32-34 te Zutphen mogen w...
Areal
Ca. 265 m2
Pris pr. md.
Not stated
Område
Zutphen, Gelderland
Type
Office space
Office space in Zutphen, Gelderland
 More info
Office space in Zutphen, Gelderland
Office space for rent in Zutphen, Gelderland
Areal
Ca. 445 m2
Pris pr. md.
Ca. 4,700 EUR pr md
Område
Zutphen, Gelderland
Type
Office space
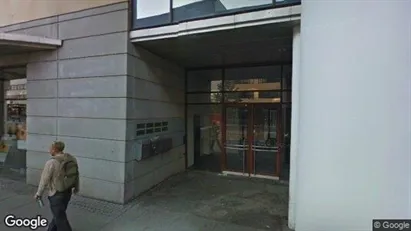
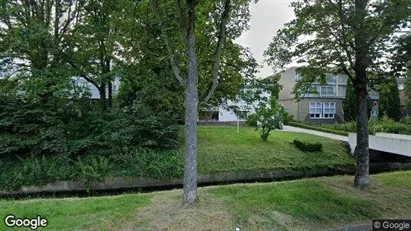
Office space in The Hague Centrum, The Hague
 More info
Office space in The Hague Centrum, The Hague
Office space for rent in The Hague Centrum, The Hague
Areal
Ca. 80 m2
Pris pr. md.
Ca. 1,550 EUR pr md
Område
The Hague Centrum, The Hague
Type
Office space
Office space in Monza, Lombardia
 More info
Office space in Monza, Lombardia
Office space for rent in Monza, Lombardia
Areal
Ca. 140 m2
Pris pr. md.
Ca. 100 EUR pr md
Område
Monza, Lombardia
Type
Office space
Office space in Den Bosch, North Brabant
 More info
Office space in Den Bosch, North Brabant
Office space for rent in Den Bosch, North Brabant
Areal
Ca. 235 m2
Pris pr. md.
Ca. 450 EUR pr md
Område
Den Bosch, North Brabant
Type
Office space
Office property in Frameries, Henegouwen
 More info
Office property in Frameries, Henegouwen
Office space for sale in Frameries, Henegouwen
Areal
Ca. 1,680 m2
Pris
Ca. 475,000EUR
Område
Frameries, Henegouwen
Type
Office space
Office space in Turku, Varsinais-Suomi
 More info
Office space in Turku, Varsinais-Suomi
Office space for rent in Turku, Varsinais-Suomi
Areal
-
Pris pr. md.
Not stated
Område
Turku, Varsinais-Suomi
Type
Office space
Office space in Aarhus C, Aarhus
 More info
Office space in Aarhus C, Aarhus
Office space for rent in Aarhus C, Aarhus
Areal
Ca. 360 m2
Pris pr. md.
Ca. 31,150 DKK pr md
Område
Aarhus C, Aarhus
Type
Office space
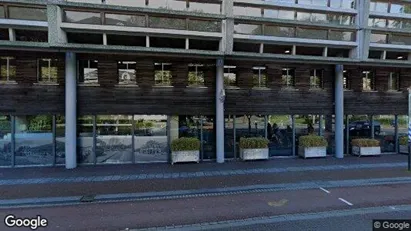
Office space in Amsterdam Centrum, Amsterdam
 More info
Office space in Amsterdam Centrum, Amsterdam
Office space for rent in Amsterdam Centrum, Amsterdam
Areal
Ca. 105 m2
Pris pr. md.
Not stated
Område
Amsterdam Centrum, Amsterdam
Type
Office space
Office space in Haarlem, North Holland
 More info
Office space in Haarlem, North Holland
Office space for rent in Haarlem, North Holland
Areal
Ca. 225 m2
Pris pr. md.
Ca. 8,400 EUR pr md
Område
Haarlem, North Holland
Type
Office space
Office space in Haarlem, North Holland
 More info
Office space in Haarlem, North Holland
Office space for rent in Haarlem, North Holland
Areal
Ca. 30 m2
Pris pr. md.
Ca. 1,100 EUR pr md
Område
Haarlem, North Holland
Type
Office space
Office space in Doetinchem, Gelderland
 More info
Office space in Doetinchem, Gelderland
TE HUUR - Koopmanslaan 27B te Doetinchem.
Op de eerste verdieping komt een zelfstandige en hoogwaardig afgewerkte kantoorruimte van ca. 350m2 beschikbaa...
Areal
Ca. 350 m2
Pris pr. md.
Ca. 3,000 EUR pr md
Område
Doetinchem, Gelderland
Type
Office space
Office property in Pelt, Limburg
 More info
Office property in Pelt, Limburg
Office space for sale in Pelt, Limburg
Areal
Ca. 160 m2
Pris
Ca. 259,000EUR
Område
Pelt, Limburg
Type
Office space
Office space in Houten, Province of Utrecht
 More info
Office space in Houten, Province of Utrecht
Office space for rent in Houten, Province of Utrecht
Areal
-
Pris pr. md.
Not stated
Område
Houten, Province of Utrecht
Type
Office space
Office space in Sittard-Geleen, Limburg
 More info
Office space in Sittard-Geleen, Limburg
Atelier Wielders:
Een verzamelplek van creatieve en eigenzinnige ondernemers in de wereld van ontwerp en zorggelegen in een rijks monumentale kantoorvilla...
Areal
Ca. 25 m2
Pris pr. md.
Ca. 8,350 EUR pr md
Område
Sittard-Geleen, Limburg
Type
Office space
Office space in Haarlem, North Holland
 More info
Office space in Haarlem, North Holland
Office space for rent in Haarlem, North Holland
Areal
Ca. 65 m2
Pris pr. md.
Ca. 2,450 EUR pr md
Område
Haarlem, North Holland
Type
Office space
Office space in Papendrecht, South Holland
 More info
Office space in Papendrecht, South Holland
Kantoor te huur in Papendrecht, Zuid-Holland
Areal
Ca. 125 m2
Pris pr. md.
Ca. 1,450 EUR pr md
Område
Papendrecht, South Holland
Type
Office space
Selected customers
30,000 customers use Companyspace.com
30,000 customers
285,000 companies in our database
2,400 rentals annually
Companyspace.com is used by thousands of landlords, property companies, commercial real estate agents, investors and business centres seeking greater visibility, more enquiries and lower vacancy rates.


