


Office spaces in Europe
Companyspace.com today:
New today 31
Updated 24h 111
Copenhagen +2
Stockholm +1
Vienna +6
Latest update 54 min ago
Active ads 366,120
144,271 office spaces found
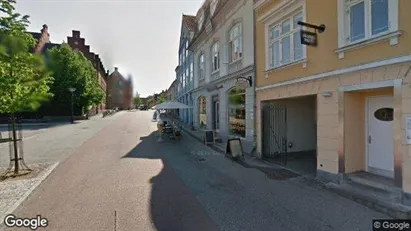
Office space in Odense C, Odense
 More info
Office space in Odense C, Odense
Office space for rent in Odense C, Odense
Areal
Ca. 545 m2
Pris pr. md.
Ca. 54,150 DKK pr md
Område
Odense C, Odense
Type
Office space
Office space in Järvenpää, Uusimaa
 More info
Office space in Järvenpää, Uusimaa
Office space for rent in Järvenpää, Uusimaa
Areal
Ca. 70 m2
Pris pr. md.
Not stated
Område
Järvenpää, Uusimaa
Type
Office space
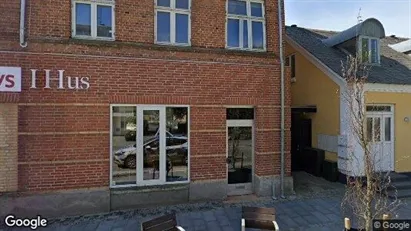
Office space in Hadsten, Central Jutland Region
 More info
Office space in Hadsten, Central Jutland Region
Office space for rent in Hadsten, Central Jutland Region
Areal
Ca. 120 m2
Pris pr. md.
Ca. 10,400 DKK pr md
Område
Hadsten, Central Jutland Region
Type
Office space
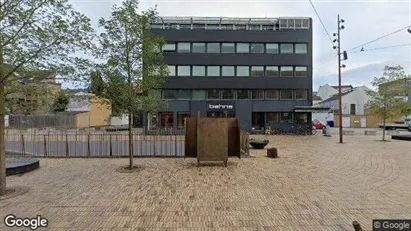
Office space in Hillerød, North Zealand
 More info
Office space in Hillerød, North Zealand
Office space for rent in Hillerød, North Zealand
Areal
Ca. 110 m2
Pris pr. md.
Ca. 11,000 DKK pr md
Område
Hillerød, North Zealand
Type
Office space
Office space in Esbjerg, Esbjerg (region)
More info
Office space in Esbjerg, Esbjerg (region)
Office space for rent in Esbjerg, Esbjerg (region)
Areal
Ca. 90 m2
Pris pr. md.
Ca. 9,750 DKK pr md
Område
Esbjerg, Esbjerg (region)
Type
Office space
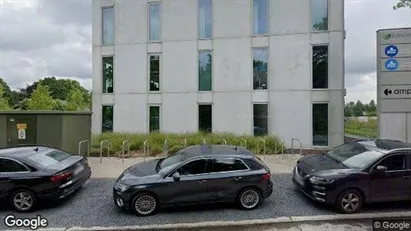
Office space in Lokeren, Oost-Vlaanderen
 More info
Office space in Lokeren, Oost-Vlaanderen
Office space for rent in Lokeren, Oost-Vlaanderen
Areal
Ca. 445 m2
Pris pr. md.
Ca. 5,900 EUR pr md
Område
Lokeren, Oost-Vlaanderen
Type
Office space
Office space in Copenhagen K, Copenhagen
More info
Office space in Copenhagen K, Copenhagen
Office space for rent in Copenhagen K, Copenhagen
Areal
Ca. 245 m2
Pris pr. md.
Ca. 39,200 DKK pr md
Område
Copenhagen K, Copenhagen
Type
Office space
Office space in Glamsbjerg, Funen
 More info
Office space in Glamsbjerg, Funen
Office space for rent in Glamsbjerg, Funen
Areal
Ca. 95 m2
Pris pr. md.
Ca. 4,800 DKK pr md
Område
Glamsbjerg, Funen
Type
Office space
Office space in Køge, Greater Copenhagen
More info
Office space in Køge, Greater Copenhagen
Office space for rent in Køge, Greater Copenhagen
Areal
Ca. 190 m2
Pris pr. md.
Ca. 22,850 DKK pr md
Område
Køge, Greater Copenhagen
Type
Office space
Office space in Odense C, Odense
 More info
Office space in Odense C, Odense
Office space for rent in Odense C, Odense
Areal
Ca. 265 m2
Pris pr. md.
Ca. 15,450 DKK pr md
Område
Odense C, Odense
Type
Office space
Office space in Sønderborg, Region of Southern Denmark
 More info
Office space in Sønderborg, Region of Southern Denmark
Office space for rent in Sønderborg, Region of Southern Denmark
Areal
Ca. 1,000 m2
Pris pr. md.
Ca. 108,350 DKK pr md
Område
Sønderborg, Region of Southern Denmark
Type
Office space
Office space in Holbæk, Region Zealand
 More info
Office space in Holbæk, Region Zealand
Office space for rent in Holbæk, Region Zealand
Areal
Ca. 70 m2
Pris pr. md.
Ca. 5,850 DKK pr md
Område
Holbæk, Region Zealand
Type
Office space
Office space in Glamsbjerg, Funen
 More info
Office space in Glamsbjerg, Funen
Office space for rent in Glamsbjerg, Funen
Areal
Ca. 250 m2
Pris pr. md.
Ca. 12,500 DKK pr md
Område
Glamsbjerg, Funen
Type
Office space
Office space in Brønderslev, North Jutland Region
 More info
Office space in Brønderslev, North Jutland Region
Office space for rent in Brønderslev, North Jutland Region
Areal
Ca. 180 m2
Pris pr. md.
Ca. 6,850 DKK pr md
Område
Brønderslev, North Jutland Region
Type
Office space
Office space in Hørsholm, Greater Copenhagen
More info
Office space in Hørsholm, Greater Copenhagen
Office space for rent in Hørsholm, Greater Copenhagen
Areal
Ca. 30 m2
Pris pr. md.
Not stated
Område
Hørsholm, Greater Copenhagen
Type
Office space
Office space in Horsens, Central Jutland Region
 More info
Office space in Horsens, Central Jutland Region
Office space for rent in Horsens, Central Jutland Region
Areal
Ca. 540 m2
Pris pr. md.
Ca. 31,500 DKK pr md
Område
Horsens, Central Jutland Region
Type
Office space
Office space in Nørrebro, Copenhagen
More info
Office space in Nørrebro, Copenhagen
Office space for rent in Nørrebro, Copenhagen
Areal
-
Pris pr. md.
Not stated
Område
Nørrebro, Copenhagen
Type
Office space
Office space in Brussels Oudergem, Brussels
 More info
Office space in Brussels Oudergem, Brussels
Office space for rent in Brussels Oudergem, Brussels
Areal
Ca. 15 m2
Pris pr. md.
Ca. 1,050 EUR pr md
Område
Brussels Oudergem, Brussels
Type
Office space
Selected customers
30,000 customers use Companyspace.com
30,000 customers
285,000 companies in our database
2,400 rentals annually
Companyspace.com is used by thousands of landlords, property companies, commercial real estate agents, investors and business centres seeking greater visibility, more enquiries and lower vacancy rates.


