


Office spaces in Europe
Companyspace.com today:
New today 10
Updated 24h 1,787
Warsaw +3
Latest update 1 min ago
Active ads 366,321
143,904 office spaces found
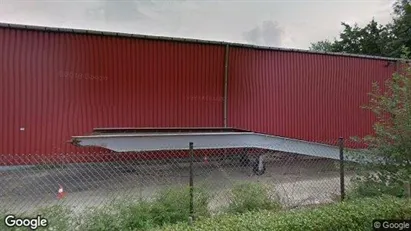
Office space in Beveren, Oost-Vlaanderen
 More info
Office space in Beveren, Oost-Vlaanderen
Office space for rent in Beveren, Oost-Vlaanderen
Areal
Ca. 215 m2
Pris pr. md.
Ca. 1,750 EUR pr md
Område
Beveren, Oost-Vlaanderen
Type
Office space
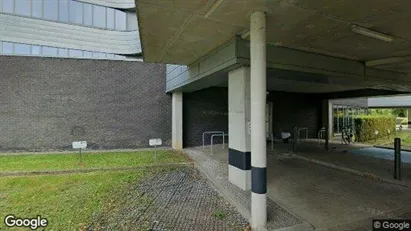
Office space in Ottignies-Louvain-la-Neuve, Waals-Brabant
 More info
Office space in Ottignies-Louvain-la-Neuve, Waals-Brabant
Office space for rent in Ottignies-Louvain-la-Neuve, Waals-Brabant
Areal
Ca. 910 m2
Pris pr. md.
Ca. 11,400 EUR pr md
Område
Ottignies-Louvain-la-Neuve, Waals-Brabant
Type
Office space
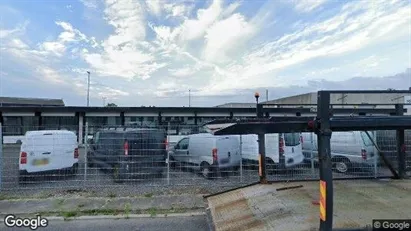
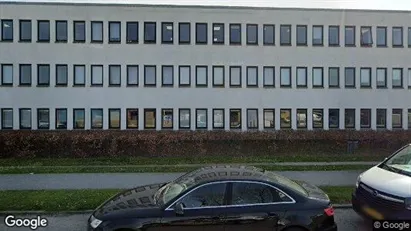
Office space in Helsingør, North Zealand
 More info
Office space in Helsingør, North Zealand
Office space for rent in Helsingør, North Zealand
Areal
Ca. 615 m2
Pris pr. md.
Ca. 61,600 DKK pr md
Område
Helsingør, North Zealand
Type
Office space
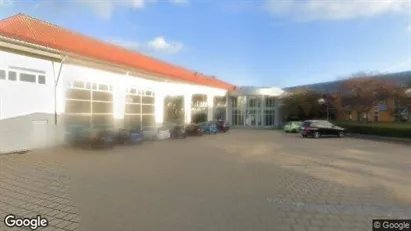
Office space in Søborg, Greater Copenhagen
 More info
Office space in Søborg, Greater Copenhagen
Office space for rent in Søborg, Greater Copenhagen
Areal
Ca. 330 m2
Pris pr. md.
Ca. 23,250 DKK pr md
Område
Søborg, Greater Copenhagen
Type
Office space
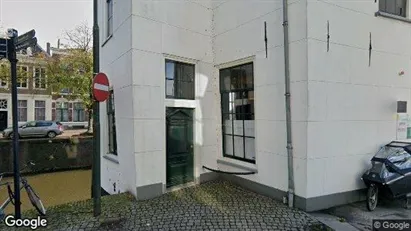
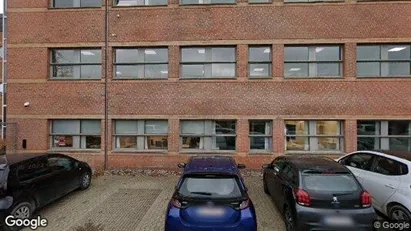
Office space in Gouda, South Holland
 More info
Office space in Gouda, South Holland
Office space for rent in Gouda, South Holland
Areal
Ca. 505 m2
Pris pr. md.
Ca. 1,100 EUR pr md
Område
Gouda, South Holland
Type
Office space
Office space in Brøndby, Greater Copenhagen
 More info
Office space in Brøndby, Greater Copenhagen
Office space for rent in Brøndby, Greater Copenhagen
Areal
Ca. 560 m2
Pris pr. md.
Ca. 44,200 DKK pr md
Område
Brøndby, Greater Copenhagen
Type
Office space
Office space in Ishøj, Greater Copenhagen
 More info
Office space in Ishøj, Greater Copenhagen
Office space for rent in Ishøj, Greater Copenhagen
Areal
Ca. 3,250 m2
Pris pr. md.
Ca. 169,250 DKK pr md
Område
Ishøj, Greater Copenhagen
Type
Office space
Office space in Herlev, Greater Copenhagen
 More info
Office space in Herlev, Greater Copenhagen
Office space for rent in Herlev, Greater Copenhagen
Areal
Ca. 405 m2
Pris pr. md.
Ca. 15,100 DKK pr md
Område
Herlev, Greater Copenhagen
Type
Office space
Office space in Glostrup, Greater Copenhagen
 More info
Office space in Glostrup, Greater Copenhagen
Office space for rent in Glostrup, Greater Copenhagen
Areal
Ca. 45 m2
Pris pr. md.
Ca. 3,800 DKK pr md
Område
Glostrup, Greater Copenhagen
Type
Office space
Office space in Helsingør, North Zealand
 More info
Office space in Helsingør, North Zealand
Office space for rent in Helsingør, North Zealand
Areal
Ca. 215 m2
Pris pr. md.
Ca. 21,500 DKK pr md
Område
Helsingør, North Zealand
Type
Office space
Office space in Vallensbæk Strand, Greater Copenhagen
 More info
Office space in Vallensbæk Strand, Greater Copenhagen
Office space for rent in Vallensbæk Strand, Greater Copenhagen
Areal
Ca. 510 m2
Pris pr. md.
Ca. 42,200 DKK pr md
Område
Vallensbæk Strand, Greater Copenhagen
Type
Office space
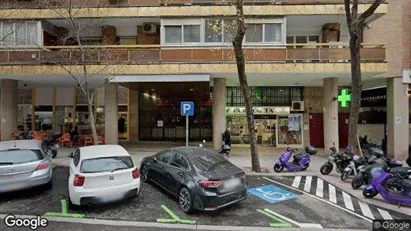
Office space in Madrid Tetuán, Madrid
 More info
Office space in Madrid Tetuán, Madrid
Office space for rent in Madrid Tetuán, Madrid
Areal
180 - 190 m2
Pris pr. md.
Ca. 8,150 EUR pr md
Område
Madrid Tetuán, Madrid
Type
Office space
Office space in Farum, North Zealand
 More info
Office space in Farum, North Zealand
Office space for rent in Farum, North Zealand
Areal
Ca. 230 m2
Pris pr. md.
Ca. 14,400 DKK pr md
Område
Farum, North Zealand
Type
Office space
Office space in Glostrup, Greater Copenhagen
 More info
Office space in Glostrup, Greater Copenhagen
Office space for rent in Glostrup, Greater Copenhagen
Areal
Ca. 970 m2
Pris pr. md.
Ca. 44,400 DKK pr md
Område
Glostrup, Greater Copenhagen
Type
Office space
Office space in Herlev, Greater Copenhagen
 More info
Office space in Herlev, Greater Copenhagen
Office space for rent in Herlev, Greater Copenhagen
Areal
Ca. 1,535 m2
Pris pr. md.
Ca. 57,650 DKK pr md
Område
Herlev, Greater Copenhagen
Type
Office space
Office space in Herlev, Greater Copenhagen
 More info
Office space in Herlev, Greater Copenhagen
Office space for rent in Herlev, Greater Copenhagen
Areal
Ca. 250 m2
Pris pr. md.
Ca. 15,500 DKK pr md
Område
Herlev, Greater Copenhagen
Type
Office space
Office space in Brøndby, Greater Copenhagen
 More info
Office space in Brøndby, Greater Copenhagen
Office space for rent in Brøndby, Greater Copenhagen
Areal
Ca. 530 m2
Pris pr. md.
Ca. 41,600 DKK pr md
Område
Brøndby, Greater Copenhagen
Type
Office space
Office space in Gouda, South Holland
 More info
Office space in Gouda, South Holland
Office space for rent in Gouda, South Holland
Areal
Ca. 45 m2
Pris pr. md.
Ca. 300 EUR pr md
Område
Gouda, South Holland
Type
Office space
Selected customers
30,000 customers use Companyspace.com
30,000 customers
285,000 companies in our database
2,400 rentals annually
Companyspace.com is used by thousands of landlords, property companies, commercial real estate agents, investors and business centres seeking greater visibility, more enquiries and lower vacancy rates.


