


Office spaces in Europe
Companyspace.com today:
New today 949
Updated 24h 949
Notifications about new companyspaces6,715
Copenhagen +23
Stockholm +2
Berlin +115
Vienna +29
Roma (region) +1
Greater London +1
Latest update 13 min ago
Active ads 365,975
144,190 office spaces found
Office space in Utrecht West, Utrecht
 More info
Office space in Utrecht West, Utrecht
Kantoor te huur in Utrecht West, Utrecht
Areal
23 - 46 m2
Pris pr. md.
Ca. 500 EUR pr md
Område
Utrecht West, Utrecht
Type
Office space
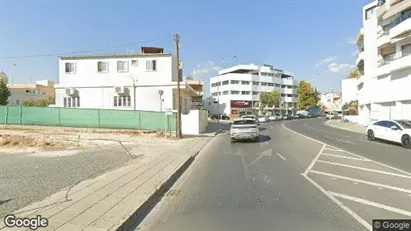
Office property in Athens Kolonaki, Athens
 More info
Office property in Athens Kolonaki, Athens
Office space for sale in Athens Kolonaki, Athens
Areal
Ca. 40 m2
Pris
Ca. 220,000EUR
Område
Athens Kolonaki, Athens
Type
Office space
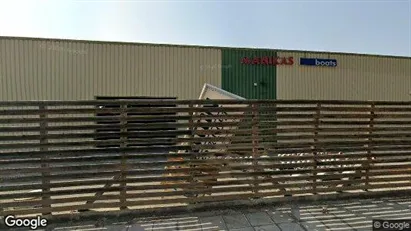
Office space in Patras, Western Greece
 More info
Office space in Patras, Western Greece
Office space for rent in Patras, Western Greece
Areal
Ca. 670 m2
Pris pr. md.
Ca. 4,200 EUR pr md
Område
Patras, Western Greece
Type
Office space
Office property in Mesa Geitonia, Limassol (Eparchies)
 More info
Office property in Mesa Geitonia, Limassol (Eparchies)
Office space for sale in Mesa Geitonia, Limassol (Eparchies)
Areal
Ca. 5 m2
Pris
Ca. 5,500,000EUR
Område
Mesa Geitonia, Limassol (Eparchies)
Type
Office space
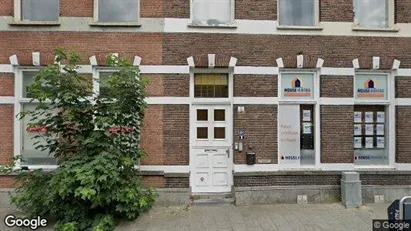
Office space in Breda, North Brabant
 More info
Office space in Breda, North Brabant
Office space for rent in Breda, North Brabant
Areal
Ca. 110 m2
Pris pr. md.
Ca. 1,750 EUR pr md
Område
Breda, North Brabant
Type
Office space
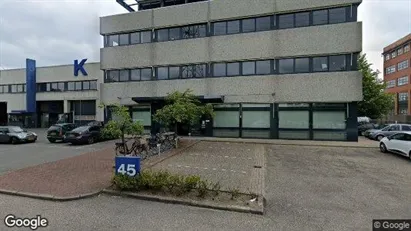
Office space in Rotterdam Prins Alexander, Rotterdam
 More info
Office space in Rotterdam Prins Alexander, Rotterdam
Office space for rent in Rotterdam Prins Alexander, Rotterdam
Areal
Ca. 240 m2
Pris pr. md.
Ca. 8,250 EUR pr md
Område
Rotterdam Prins Alexander, Rotterdam
Type
Office space
Office space in Rotterdam Prins Alexander, Rotterdam
 More info
Office space in Rotterdam Prins Alexander, Rotterdam
Office space for rent in Rotterdam Prins Alexander, Rotterdam
Areal
Ca. 30 m2
Pris pr. md.
Ca. 1,650 EUR pr md
Område
Rotterdam Prins Alexander, Rotterdam
Type
Office space
Office space in Odense C, Odense
 More info
Office space in Odense C, Odense
Office space for rent in Odense C, Odense
Areal
Ca. 365 m2
Pris pr. md.
Ca. 28,200 DKK pr md
Område
Odense C, Odense
Type
Office space
Office space in Holte, Greater Copenhagen
More info
Office space in Holte, Greater Copenhagen
Office space for rent in Holte, Greater Copenhagen
Areal
Ca. 235 m2
Pris pr. md.
Not stated
Område
Holte, Greater Copenhagen
Type
Office space
Office space in Vesterbro, Copenhagen
More info
Office space in Vesterbro, Copenhagen
Office space for rent in Vesterbro, Copenhagen
Areal
Ca. 620 m2
Pris pr. md.
Ca. 82,000 DKK pr md
Område
Vesterbro, Copenhagen
Type
Office space
Office space in Rotterdam Prins Alexander, Rotterdam
 More info
Office space in Rotterdam Prins Alexander, Rotterdam
Office space for rent in Rotterdam Prins Alexander, Rotterdam
Areal
Ca. 15 m2
Pris pr. md.
Ca. 750 EUR pr md
Område
Rotterdam Prins Alexander, Rotterdam
Type
Office space
Office space in Odense C, Odense
More info
Office space in Odense C, Odense
Office space for rent in Odense C, Odense
Areal
Ca. 260 m2
Pris pr. md.
Ca. 10,800 DKK pr md
Område
Odense C, Odense
Type
Office space
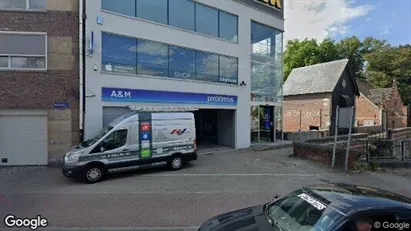
Office property in Mechelen, Antwerp (Province)
 More info
Office property in Mechelen, Antwerp (Province)
Office space for sale in Mechelen, Antwerp (Province)
Areal
Ca. 1,070 m2
Pris
Ca. 2,200,000EUR
Område
Mechelen, Antwerp (Province)
Type
Office space
Office space in Frederiksberg C, Copenhagen
 More info
Office space in Frederiksberg C, Copenhagen
Office space for rent in Frederiksberg C, Copenhagen
Areal
Ca. 50 m2
Pris pr. md.
Not stated
Område
Frederiksberg C, Copenhagen
Type
Office space
Office space in Risskov, Aarhus
 More info
Office space in Risskov, Aarhus
Office space for rent in Risskov, Aarhus
Areal
Ca. 235 m2
Pris pr. md.
Ca. 14,700 DKK pr md
Område
Risskov, Aarhus
Type
Office space
Office space in Amsterdam Oud-Zuid, Amsterdam
 More info
Office space in Amsterdam Oud-Zuid, Amsterdam
CreativeGrounds biedt hoogwaardige private offices in verschillende authentieke villa's in Amsterdam Oud-Zuid. Emmalaan 7-9 is volledig verhuurd maar binnenk...
Areal
Ca. 755 m2
Pris pr. md.
Ca. 8,350 EUR pr md
Område
Amsterdam Oud-Zuid, Amsterdam
Type
Office space
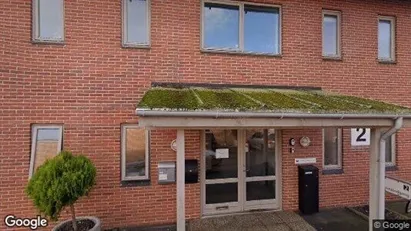
Office space in Birkerød, North Zealand
More info
Office space in Birkerød, North Zealand
Office space for rent in Birkerød, North Zealand
Areal
Ca. 400 m2
Pris pr. md.
Ca. 28,350 DKK pr md
Område
Birkerød, North Zealand
Type
Office space
Office space in Dublin 18, Dublin
 More info
Office space in Dublin 18, Dublin
Office space for rent in Dublin 18, Dublin
Areal
Ca. 100 m2
Pris pr. md.
Ca. 2,350 EUR pr md
Område
Dublin 18, Dublin
Type
Office space
Selected customers
30,000 customers use Companyspace.com
30,000 customers
285,000 companies in our database
2,400 rentals annually
Companyspace.com is used by thousands of landlords, property companies, commercial real estate agents, investors and business centres seeking greater visibility, more enquiries and lower vacancy rates.


