


Commercial properties in Europe
Companyspace.com today:
New today 146
Updated 24h 1,238
Copenhagen +1
Stockholm +1
Amsterdam +1
Berlin +1
Vienna +10
Lisbon +1
Latest update 1 min ago
Active ads 368,499
143,099 commercial properties found
Commercial property in Bilzen, Limburg
 More info
Commercial property in Bilzen, Limburg
Commercial property for sale in Bilzen, Limburg
Areal
Ca. 405 m2
Pris
Ca. 625,000EUR
Område
Bilzen, Limburg
Type
Commercial property
Commercial space in Kortrijk, West-Vlaanderen
 More info
Commercial space in Kortrijk, West-Vlaanderen
Commercial space for rent in Kortrijk, West-Vlaanderen
Areal
-
Pris pr. md.
Ca. 3,450 EUR pr md
Område
Kortrijk, West-Vlaanderen
Type
Commercial property
Commercial property in Brussels Evere, Brussels
 More info
Commercial property in Brussels Evere, Brussels
Commercial property for sale in Brussels Evere, Brussels
Areal
Ca. 1,425 m2
Pris
Ca. 1,350,000EUR
Område
Brussels Evere, Brussels
Type
Commercial property
Commercial property in Maasmechelen, Limburg
 More info
Commercial property in Maasmechelen, Limburg
Commercial property for sale in Maasmechelen, Limburg
Areal
-
Pris
Ca. 675,000EUR
Område
Maasmechelen, Limburg
Type
Commercial property
Commercial space in Waregem, West-Vlaanderen
 More info
Commercial space in Waregem, West-Vlaanderen
Commercial space for rent in Waregem, West-Vlaanderen
Areal
Ca. 25 m2
Pris pr. md.
Ca. 1,500 EUR pr md
Område
Waregem, West-Vlaanderen
Type
Commercial property
Commercial property in Hoorn, North Holland
 More info
Commercial property in Hoorn, North Holland
Commercial property for sale in Hoorn, North Holland
Areal
Ca. 90 m2
Pris
Ca. 325,000EUR
Område
Hoorn, North Holland
Type
Commercial property
Commercial space in Tilburg, North Brabant
 More info
Commercial space in Tilburg, North Brabant
Commercial space for rent in Tilburg, North Brabant
Areal
Ca. 165 m2
Pris pr. md.
Ca. 1,200 EUR pr md
Område
Tilburg, North Brabant
Type
Commercial property
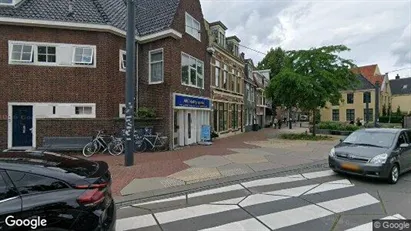
Commercial property in Leeuwarden, Friesland NL
 More info
Commercial property in Leeuwarden, Friesland NL
Commercial property for sale in Leeuwarden, Friesland NL
Areal
-
Pris
Ca. 299,000EUR
Område
Leeuwarden, Friesland NL
Type
Commercial property
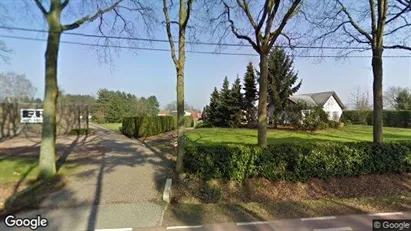
Commercial property in Kasterlee, Antwerp (Province)
 More info
Commercial property in Kasterlee, Antwerp (Province)
Commercial property for sale in Kasterlee, Antwerp (Province)
Areal
-
Pris
Ca. 392,000EUR
Område
Kasterlee, Antwerp (Province)
Type
Commercial property
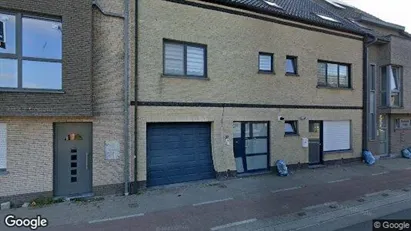
Commercial property in Sint-Gillis-Waas, Oost-Vlaanderen
 More info
Commercial property in Sint-Gillis-Waas, Oost-Vlaanderen
Commercial property for sale in Sint-Gillis-Waas, Oost-Vlaanderen
Areal
Ca. 335 m2
Pris
Ca. 575,000EUR
Område
Sint-Gillis-Waas, Oost-Vlaanderen
Type
Commercial property
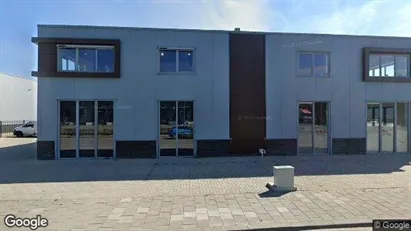
Commercial space in Apeldoorn, Gelderland
 More info
Commercial space in Apeldoorn, Gelderland
Commercial space for rent in Apeldoorn, Gelderland
Areal
Ca. 145 m2
Pris pr. md.
Ca. 1,750 EUR pr md
Område
Apeldoorn, Gelderland
Type
Commercial property
Commercial property in Oostende, West-Vlaanderen
 More info
Commercial property in Oostende, West-Vlaanderen
Commercial property for sale in Oostende, West-Vlaanderen
Areal
Ca. 475 m2
Pris
Ca. 180,000EUR
Område
Oostende, West-Vlaanderen
Type
Commercial property
Commercial property in Mol, Antwerp (Province)
 More info
Commercial property in Mol, Antwerp (Province)
Commercial property for sale in Mol, Antwerp (Province)
Areal
-
Pris
Ca. 555,000EUR
Område
Mol, Antwerp (Province)
Type
Commercial property
Commercial space in Uithoorn, North Holland
 More info
Commercial space in Uithoorn, North Holland
Commercial space for rent in Uithoorn, North Holland
Areal
Ca. 140 m2
Pris pr. md.
Ca. 1,500 EUR pr md
Område
Uithoorn, North Holland
Type
Commercial property
Commercial property in Diest, Vlaams-Brabant
 More info
Commercial property in Diest, Vlaams-Brabant
Commercial property for sale in Diest, Vlaams-Brabant
Areal
-
Pris
Ca. 325,000EUR
Område
Diest, Vlaams-Brabant
Type
Commercial property
Commercial space in Almere, Flevoland
 More info
Commercial space in Almere, Flevoland
Commercial space for rent in Almere, Flevoland
Areal
Ca. 125 m2
Pris pr. md.
Ca. 150 EUR pr md
Område
Almere, Flevoland
Type
Commercial property
Commercial property in Meulebeke, West-Vlaanderen
 More info
Commercial property in Meulebeke, West-Vlaanderen
Commercial property for sale in Meulebeke, West-Vlaanderen
Areal
Ca. 195 m2
Pris
Ca. 277,000EUR
Område
Meulebeke, West-Vlaanderen
Type
Commercial property
Commercial space in Hasselt, Limburg
 More info
Commercial space in Hasselt, Limburg
Commercial space for rent in Hasselt, Limburg
Areal
Ca. 25 m2
Pris pr. md.
Ca. 1,600 EUR pr md
Område
Hasselt, Limburg
Type
Commercial property
Selected customers
30,000 customers use Companyspace.com
30,000 customers
285,000 companies in our database
2,400 rentals annually
Companyspace.com is used by thousands of landlords, property companies, commercial real estate agents, investors and business centres seeking greater visibility, more enquiries and lower vacancy rates.


