


Commercial properties in Europe
Companyspace.com today:
New today 962
Updated 24h 1,201
Notifications about new companyspaces124
Copenhagen +133
Stockholm +1
Amsterdam +7
Brussels +1
Vienna +3
Latest update 1 min ago
Active ads 369,146
142,858 commercial properties found
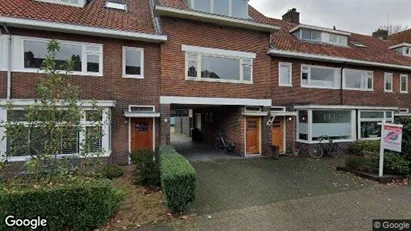
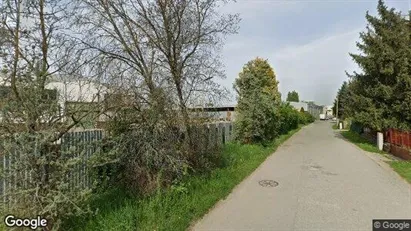
Commercial property in Purmerend, North Holland
 More info
Commercial property in Purmerend, North Holland
Commercial property for sale in Purmerend, North Holland
Areal
Ca. 100 m2
Pris
Ca. 149,000EUR
Område
Purmerend, North Holland
Type
Commercial property
Commercial space in Łódź, Łódzkie
 More info
Commercial space in Łódź, Łódzkie
Commercial space for rent in Łódź, Łódzkie
Areal
Ca. 250 m2
Pris pr. md.
Ca. 7,000 PLN pr md
Område
Łódź, Łódzkie
Type
Commercial property
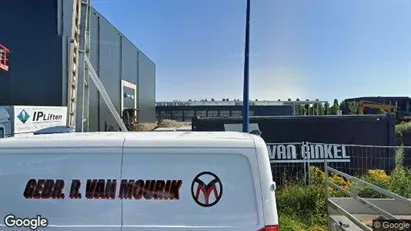
Commercial space in Utrecht Noord-Oost, Utrecht
 More info
Commercial space in Utrecht Noord-Oost, Utrecht
Commercial space for rent in Utrecht Noord-Oost, Utrecht
Areal
Ca. 135 m2
Pris pr. md.
Ca. 1,500 EUR pr md
Område
Utrecht Noord-Oost, Utrecht
Type
Commercial property
Commercial space in Norrköping, Östergötland County
 More info
Commercial space in Norrköping, Östergötland County
Commercial space for rent in Norrköping, Östergötland County
Areal
Ca. 50 m2
Pris pr. md.
Ca. 8,300 SEK pr md
Område
Norrköping, Östergötland County
Type
Commercial property
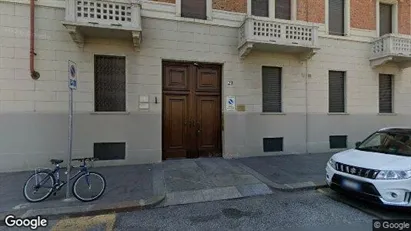
Commercial space in Torino, Piemonte
 More info
Commercial space in Torino, Piemonte
Commercial space for rent in Torino, Piemonte
Areal
Ca. 65 m2
Pris pr. md.
Ca. 1,050 EUR pr md
Område
Torino, Piemonte
Type
Commercial property
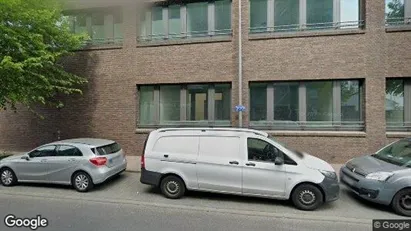
Commercial space in Frankfurt Bornheim/Ostend, Frankfurt (region)
 More info
Commercial space in Frankfurt Bornheim/Ostend, Frankfurt (region)
Commercial space for rent in Frankfurt Bornheim/Ostend, Frankfurt (region)
Areal
310 - 4,800 m2
Pris pr. md.
Not stated
Område
Frankfurt Bornheim/Ostend, Frankfurt (region)
Type
Commercial property
Commercial space in Łódź, Łódzkie
 More info
Commercial space in Łódź, Łódzkie
Commercial space for rent in Łódź, Łódzkie
Areal
Ca. 285 m2
Pris pr. md.
Ca. 16,150 PLN pr md
Område
Łódź, Łódzkie
Type
Commercial property
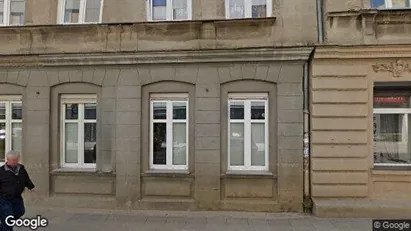
Commercial property in Košice Dargovských hrdinov, Košice
 More info
Commercial property in Košice Dargovských hrdinov, Košice
Commercial property for sale in Košice Dargovských hrdinov, Košice
Areal
Ca. 150 m2
Pris
Ca. 520,000EUR
Område
Košice Dargovských hrdinov, Košice
Type
Commercial property
Commercial space in Antwerp Wilrijk, Antwerp
 More info
Commercial space in Antwerp Wilrijk, Antwerp
Commercial space for rent in Antwerp Wilrijk, Antwerp
Areal
Ca. 15,000 m2
Pris pr. md.
Ca. 27,500 EUR pr md
Område
Antwerp Wilrijk, Antwerp
Type
Commercial property
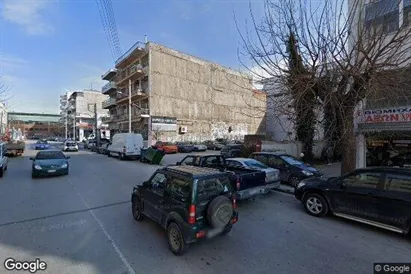
Commercial space in Thessaloniki, Central Macedonia
 More info
Commercial space in Thessaloniki, Central Macedonia
Commercial space for rent in Thessaloniki, Central Macedonia
Areal
Ca. 4,470 m2
Pris pr. md.
Ca. 26,000 EUR pr md
Område
Thessaloniki, Central Macedonia
Type
Commercial property
Commercial property in Halle, Vlaams-Brabant
 More info
Commercial property in Halle, Vlaams-Brabant
Commercial property for sale in Halle, Vlaams-Brabant
Areal
-
Pris
Ca. 149,000EUR
Område
Halle, Vlaams-Brabant
Type
Commercial property
Commercial space in Torino, Piemonte
 More info
Commercial space in Torino, Piemonte
Commercial space for rent in Torino, Piemonte
Areal
Ca. 100 m2
Pris pr. md.
Ca. 400 EUR pr md
Område
Torino, Piemonte
Type
Commercial property
Commercial space in Kallithea, Attica
 More info
Commercial space in Kallithea, Attica
Commercial space for rent in Kallithea, Attica
Areal
Ca. 600 m2
Pris pr. md.
Ca. 1,600 EUR pr md
Område
Kallithea, Attica
Type
Commercial property
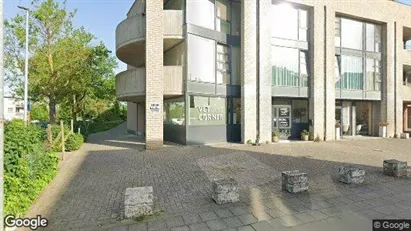
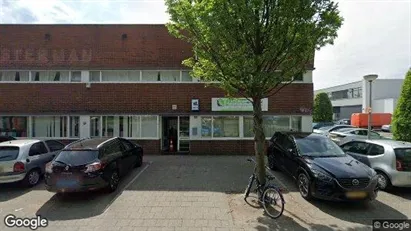
Commercial space in Amersfoort, Province of Utrecht
 More info
Commercial space in Amersfoort, Province of Utrecht
Commercial space for rent in Amersfoort, Province of Utrecht
Areal
Ca. 570 m2
Pris pr. md.
Ca. 4,750 EUR pr md
Område
Amersfoort, Province of Utrecht
Type
Commercial property
Commercial space in Norrköping, Östergötland County
More info
Commercial space in Norrköping, Östergötland County
Commercial space for rent in Norrköping, Östergötland County
Areal
Ca. 35 m2
Pris pr. md.
Ca. 5,550 SEK pr md
Område
Norrköping, Östergötland County
Type
Commercial property
Commercial space in Bergen op Zoom, North Brabant
 More info
Commercial space in Bergen op Zoom, North Brabant
Commercial space for rent in Bergen op Zoom, North Brabant
Areal
Ca. 365 m2
Pris pr. md.
Ca. 2,600 EUR pr md
Område
Bergen op Zoom, North Brabant
Type
Commercial property
Commercial property in Amersfoort, Province of Utrecht
 More info
Commercial property in Amersfoort, Province of Utrecht
Commercial property for sale in Amersfoort, Province of Utrecht
Areal
-
Pris
Ca. 210,000EUR
Område
Amersfoort, Province of Utrecht
Type
Commercial property
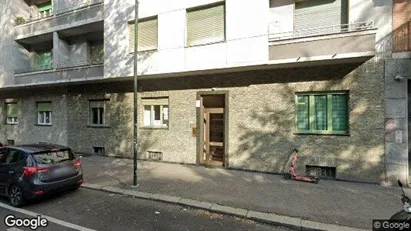
Commercial space in Amsterdam Westpoort, Amsterdam
 More info
Commercial space in Amsterdam Westpoort, Amsterdam
Commercial space for rent in Amsterdam Westpoort, Amsterdam
Areal
Ca. 1,050 m2
Pris pr. md.
Ca. 650 EUR pr md
Område
Amsterdam Westpoort, Amsterdam
Type
Commercial property
Selected customers
30,000 customers use Companyspace.com
30,000 customers
285,000 companies in our database
2,400 rentals annually
Companyspace.com is used by thousands of landlords, property companies, commercial real estate agents, investors and business centres seeking greater visibility, more enquiries and lower vacancy rates.


