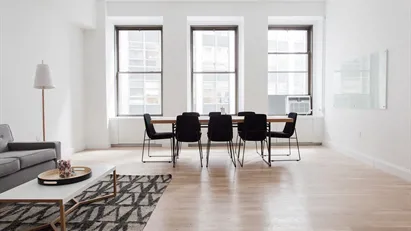
Available commercial properties
See all available commercial properties below. If you are looking for commercial property, you have come to the right place. We have most available commercial properties in our database. Find commercial property here. Enjoy.
115,798 commercial properties found
-
58 m2 commercial space for rent in Fuenlabrada, Comunidad de Madrid
- Ca. 650 EUR per month
- Ca. 150 EUR /m2/year
-
30 m2 commercial space for rent in Şelimbăr, Centru
- Ca. 300 EUR per month
- Ca. 100 EUR /m2/year
-
1000 m2 commercial space for rent in Přerov, Olomoucký kraj
- Ca. 1,000 CZK per month
- Ca. 50 CZK /m2/year
Frequently asked questions
Statistics on the development of available commercial properties for rent over the past month
Also see aggregate statistics on all available commercial properties over time, aggregate statistics on new commercial properties over time, aggregate statistics on rented commercial properties over time
| Date | |||
|---|---|---|---|
| 25. January 2026 | 115764 | 1617 | 640 |
| 24. January 2026 | 114787 | 1432 | 1541 |
| 23. January 2026 | 114896 | 1552 | 1607 |
| 22. January 2026 | 114951 | 3795 | 4022 |
| 21. January 2026 | 115178 | 1248 | 0 |
| 20. January 2026 | 113930 | 2700 | 2473 |
| 19. January 2026 | 113703 | 930 | 1318 |
| 18. January 2026 | 114091 | 1311 | 1062 |
| 17. January 2026 | 113842 | 1213 | 1272 |
| 16. January 2026 | 113901 | 2151 | 1260 |
| 15. January 2026 | 113010 | 330 | 446 |
| 14. January 2026 | 113126 | 2965 | 2748 |
| 13. January 2026 | 112909 | 1721 | 0 |
| 12. January 2026 | 111188 | 726 | 2965 |
| 11. January 2026 | 113427 | 2582 | 2180 |
| 10. January 2026 | 113025 | 2290 | 1181 |
| 9. January 2026 | 111916 | 3051 | 3323 |
| 8. January 2026 | 112188 | 2119 | 1170 |
| 7. January 2026 | 111239 | 2917 | 1806 |
| 6. January 2026 | 110128 | 1503 | 391 |
| 5. January 2026 | 109016 | 2388 | 2673 |
| 4. January 2026 | 109301 | 871 | 0 |
| 3. January 2026 | 108430 | 1590 | 1418 |
| 2. January 2026 | 108258 | 1061 | 2074 |
| 1. January 2026 | 109271 | 1098 | 1140 |
| 31. December 2025 | 109313 | 929 | 977 |
| 30. December 2025 | 109361 | 2096 | 1855 |
| 29. December 2025 | 109120 | 558 | 290 |
| 28. December 2025 | 108852 | 2465 | 2263 |
| 27. December 2025 | 108650 | 774 | 855 |
| 26. December 2025 | 108731 | 1798 | 0 |
Statistics on currently available commercial properties
Also see gathered statistics of all available commercial properties over time, the gathered statistics of new commercial properties over time, the gathered statistics of rented commercial properties over time
| Commercial properties | |
|---|---|
| Available premises | 115,771 |
| New premises since yesterday | 1,617 |
| Rented out premises since yesterday | 640 |
| Total available m2 | 439,978,640 |
| Average price per m2 per year without expenses | 20,193 |
| Highest price per m2 per year | 13,500,000 |
| Lowest price per m2 per year | 1 |


