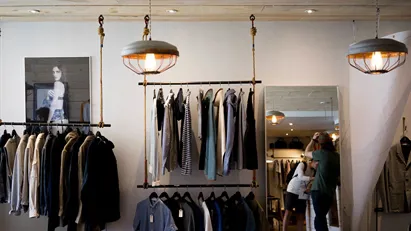
Available shops in Oberösterreich
See all available shops in Oberösterreich below. If you are looking for shop in Oberösterreich, you have come to the right place. We have most available shops in Oberösterreich in our database. Find shop in Oberösterreich here. Enjoy.
-
Shop for rent in Leonding, Oberösterreich
- Ca. 900 EUR per month
-
Ca. 35 m2 shop for rent in Altmünster, Oberösterreich
- Ca. 450 EUR per month
- Ca. 150 EUR /m2/year
-
Ca. 135 m2 shop for rent in Leonding, Oberösterreich
- Ca. 779,500 EUR per month
- Ca. 70,350 EUR /m2/year
-
Ca. 190 m2 shop for rent in Bad Ischl, Oberösterreich
- Ca. 450,000 EUR per month
- Ca. 28,400 EUR /m2/year
-
Ca. 135 m2 shop for rent in Bad Ischl, Oberösterreich
- Ca. 490,000 EUR per month
- Ca. 44,200 EUR /m2/year
-
Ca. 135 m2 shop for rent in Oberhofen am Irrsee, Oberösterreich
- Ca. 1,200 EUR per month
- Ca. 100 EUR /m2/year
-
Ca. 65 m2 shop for rent in Traun, Oberösterreich
- Ca. 1,200 EUR per month
- Ca. 200 EUR /m2/year
-
Ca. 80 m2 shop for rent in Freistadt, Oberösterreich
- Ca. 1,300 EUR per month
- Ca. 200 EUR /m2/year
-
Ca. 35 m2 shop for rent in Geretsberg, Oberösterreich
- Ca. 950 EUR per month
- Ca. 300 EUR /m2/year
-
Ca. 35 m2 shop for rent in Auerbach, Oberösterreich
- Ca. 950 EUR per month
- Ca. 300 EUR /m2/year
-
Ca. 125 m2 shop for rent in Schleißheim, Oberösterreich
- Ca. 1,450 EUR per month
- Ca. 150 EUR /m2/year
-
Ca. 190 m2 shop for rent in Innerschwand am Mondsee, Oberösterreich
- Ca. 1,200 EUR per month
- Ca. 100 EUR /m2/year
Frequently asked questions
Statistics on the development of available shops for rent in Oberösterreich over the past month
Also see aggregate statistics on all available shops in Oberösterreich over time, aggregate statistics on new shops in Oberösterreich over time, aggregate statistics on rented shops in Oberösterreich over time
| Date | |||
|---|---|---|---|
| 20. February 2026 | 147 | 6 | 5 |
| 19. February 2026 | 146 | 2 | 2 |
| 18. February 2026 | 146 | 2 | 1 |
| 17. February 2026 | 145 | 5 | 8 |
| 16. February 2026 | 148 | 2 | 2 |
| 15. February 2026 | 148 | 3 | 4 |
| 14. February 2026 | 149 | 5 | 4 |
| 13. February 2026 | 148 | 4 | 1 |
| 12. February 2026 | 145 | 6 | 5 |
| 11. February 2026 | 144 | 4 | 3 |
| 10. February 2026 | 143 | 5 | 4 |
| 9. February 2026 | 142 | 2 | 4 |
| 8. February 2026 | 144 | 1 | 5 |
| 7. February 2026 | 148 | 12 | 15 |
| 6. February 2026 | 151 | 7 | 2 |
| 5. February 2026 | 146 | 3 | 0 |
| 4. February 2026 | 143 | 4 | 6 |
| 3. February 2026 | 145 | 2 | 0 |
| 2. February 2026 | 143 | 2 | 4 |
| 1. February 2026 | 145 | 6 | 5 |
| 31. January 2026 | 144 | 8 | 6 |
| 30. January 2026 | 142 | 9 | 11 |
| 29. January 2026 | 144 | 6 | 6 |
| 28. January 2026 | 144 | 6 | 17 |
| 27. January 2026 | 155 | 7 | 6 |
| 26. January 2026 | 154 | 0 | 8 |
| 25. January 2026 | 162 | 5 | 5 |
| 24. January 2026 | 162 | 2 | 1 |
| 23. January 2026 | 161 | 7 | 6 |
| 22. January 2026 | 160 | 9 | 8 |
| 21. January 2026 | 159 | 4 | 0 |
Statistics on currently available shops in Oberösterreich in Austria
Also see gathered statistics of all available shops in Oberösterreich over time, the gathered statistics of new shops in Oberösterreich over time, the gathered statistics of rented shops in Oberösterreich over time
| Shops | |
|---|---|
| Available premises | 154 |
| New premises since yesterday | 6 |
| Rented out premises since yesterday | 5 |
| Total available m2 | 17,440 |
| Average price per m2 per year without expenses | 3,219 |
| Highest price per m2 per year | 70,332.63 |
| Lowest price per m2 per year | 41.31 |


