


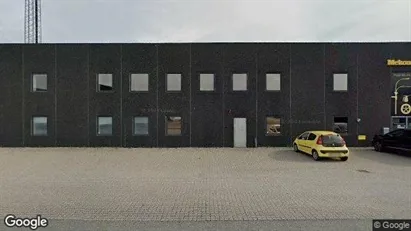
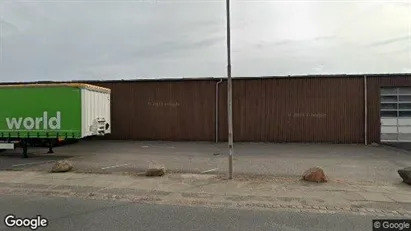
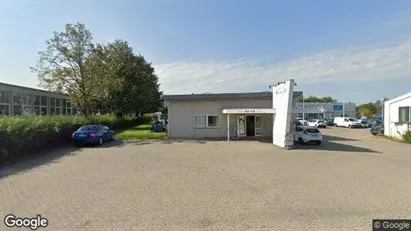
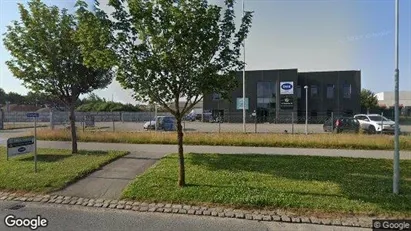
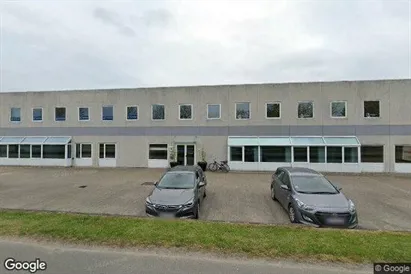
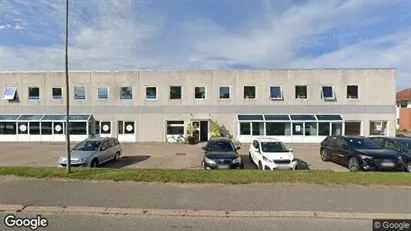
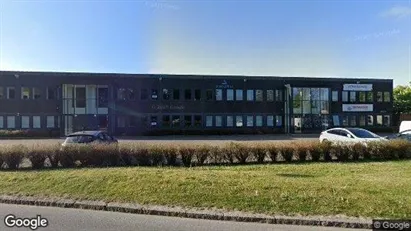
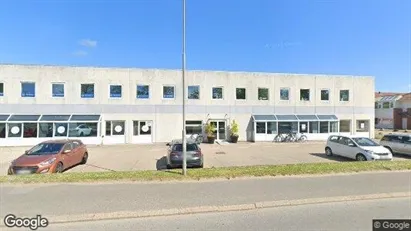
Photo provided by Google Street View and may be inaccurate:

Shop for rent, Odense S, Odense, Rolundvej 11
- Ca. 3,565 m2
- Ca. 160,000 DKK per month

GET MORE INFO NOW
View all details about the premise and get direct access to the landlord’s contact information.
Shop for rent, Odense S, Odense, Rolundvej 11

Ca. 3,565m2

Ca. 160,000 DKK

Shop

Odense S, Odense
Facts
Report errors in data- 3655339
- Shop
- Warehouse
- Industrial property
- Ca. 3,565 m2
- Ca. 1,920,000 DKK
- Ca. 160,000 DKK
- Ca. 550 DKK
Similar search results
Warehouse in Odense S, Odense
 More info
Warehouse in Odense S, Odense
Warehouse for rent in Odense S, Odense
Areal
Ca. 1,300 m2
Pris pr. md.
Ca. 48,700 DKK pr md
Område
Odense S, Odense
Type
Warehouse
Warehouse in Odense S, Odense
 More info
Warehouse in Odense S, Odense
Warehouse for rent in Odense S, Odense
Areal
Ca. 6,135 m2
Pris pr. md.
Ca. 191,700 DKK pr md
Område
Odense S, Odense
Type
Warehouse
Warehouse in Odense S, Odense
 More info
Warehouse in Odense S, Odense
Warehouse for rent in Odense S, Odense
Areal
Ca. 505 m2
Pris pr. md.
Ca. 26,100 DKK pr md
Område
Odense S, Odense
Type
Warehouse
Warehouse in Odense S, Odense
 More info
Warehouse in Odense S, Odense
Warehouse for rent in Odense S, Odense
Areal
Ca. 445 m2
Pris pr. md.
Ca. 19,600 DKK pr md
Område
Odense S, Odense
Type
Warehouse
Warehouse in Odense S, Odense
 More info
Warehouse in Odense S, Odense
Warehouse for rent in Odense S, Odense
Areal
Ca. 110 m2
Pris pr. md.
Ca. 7,000 DKK pr md
Område
Odense S, Odense
Type
Warehouse
Office space in Odense S, Odense
 More info
Office space in Odense S, Odense
Office space for rent in Odense S, Odense
Areal
Ca. 150 m2
Pris pr. md.
Ca. 6,200 DKK pr md
Område
Odense S, Odense
Type
Office space
Office space in Odense S, Odense
 More info
Office space in Odense S, Odense
Office space for rent in Odense S, Odense
Areal
Ca. 155 m2
Pris pr. md.
Ca. 6,300 DKK pr md
Område
Odense S, Odense
Type
Office space
Office space in Odense S, Odense
 More info
Office space in Odense S, Odense
Office space for rent in Odense S, Odense
Areal
Ca. 250 m2
Pris pr. md.
Ca. 15,500 DKK pr md
Område
Odense S, Odense
Type
Office space
Office space in Odense S, Odense
 More info
Office space in Odense S, Odense
Office space for rent in Odense S, Odense
Areal
Ca. 155 m2
Pris pr. md.
Ca. 8,850 DKK pr md
Område
Odense S, Odense
Type
Office space
Selected customers
30,000 customers use Companyspace.com
30,000 customers
285,000 companies in our database
2,400 rentals annually
Companyspace.com is used by thousands of landlords, property companies, commercial real estate agents, investors and business centres seeking greater visibility, more enquiries and lower vacancy rates.


