


Commercial space for rent, Seeland, Bern (Kantone),
, Seeland- Commercial space for rent
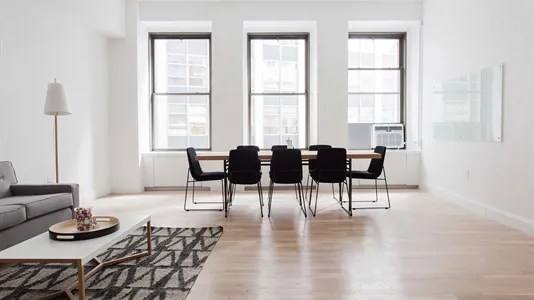
- Ca. 145 m2
- Ca. 2,400 CHF per month
![Commercial space for rent, Seeland, Bern (Kantone), <span class="blurred street" onclick="ProcessAdRequest(3636389)"><span class="hint">See streetname</span>[xxxxxxxxxxxxx]</span>](/StaticFiles/media/313122/Cache/chairs-2181947_1920_134.webp)
- Commercial space for rent
- Ca. 145 m2
- Ca. 2,400 CHF per month
This commercial rental is no longer available.
Search for similar premises on Companyspace.com
Commercial space for rent, Seeland, Bern (Kantone),
Commercial space for rent in Seeland, Bern (Kantone)
Information and data
This industrial property for rent, is located in Seeland. Seeland is located in Bern (Kantone). The company space is 145 m2 in total. You can rent this industrial property for Ca. 28,550 CHF per year.
Similar search results
-
Ca. 125 m2 industrial property for rent in Seeland, Bern (Kantone)
- Ca. 1,400 CHF per month
- Ca. 150 CHF /m2/year
-
Ca. 75 m2 industrial property for rent in Seeland, Bern (Kantone)
- Ca. 1,050 CHF per month
- Ca. 150 CHF /m2/year
-
Ca. 95 m2 industrial property for rent in Seeland, Bern (Kantone)
- Ca. 1,200 CHF per month
- Ca. 150 CHF /m2/year


Frequently asked questions
Statistics on the development of available industrial properties for rent in Seeland over the past month
Below you can see the development of available industrial properties for rent in Seeland over the past month. In the first column you see the date. In the second column you see the total amount of industrial properties for rent in Seeland on the date. In the third column you see the amount of new industrial properties in Seeland that was available for rent on the date. In the fourth column you see the amount of industrial properties in Seeland that was rented on the date. Also see aggregate statistics on all available industrial properties in Seeland over time, aggregate statistics on new industrial properties in Seeland over time, aggregate statistics on rented industrial properties in Seeland over time
| Date | All industrial properties for rent | New industrial properties for rent | Rented out industrial properties |
|---|---|---|---|
| 6. February 2026 | 6 | 2 | 0 |
| 5. February 2026 | 4 | 0 | 0 |
| 4. February 2026 | 4 | 0 | 0 |
| 3. February 2026 | 4 | 0 | 0 |
| 2. February 2026 | 4 | 0 | 0 |
| 1. February 2026 | 4 | 0 | 0 |
| 31. January 2026 | 4 | 0 | 0 |
| 30. January 2026 | 4 | 0 | 0 |
| 29. January 2026 | 4 | 0 | 0 |
| 28. January 2026 | 4 | 0 | 0 |
| 27. January 2026 | 4 | 0 | 0 |
| 26. January 2026 | 4 | 0 | 0 |
| 25. January 2026 | 4 | 0 | 0 |
| 24. January 2026 | 4 | 0 | 0 |
| 23. January 2026 | 4 | 0 | 0 |
| 22. January 2026 | 4 | 0 | 0 |
| 21. January 2026 | 4 | 0 | 0 |
| 20. January 2026 | 4 | 0 | 0 |
| 19. January 2026 | 4 | 0 | 0 |
| 18. January 2026 | 4 | 0 | 0 |
| 17. January 2026 | 4 | 0 | 0 |
| 16. January 2026 | 4 | 0 | 0 |
| 15. January 2026 | 4 | 0 | 0 |
| 14. January 2026 | 4 | 0 | 0 |
| 13. January 2026 | 4 | 0 | 0 |
| 12. January 2026 | 4 | 0 | 0 |
| 11. January 2026 | 4 | 0 | 3 |
| 10. January 2026 | 7 | 6 | 6 |
| 9. January 2026 | 7 | 6 | 0 |
| 8. January 2026 | 1 | 0 | 0 |
| 7. January 2026 | 1 | 0 | 0 |
Statistics on currently available industrial properties for rent in Seeland
In the table below, you see a series of data about available industrial properties to rent in Seeland.Also see gathered statistics of all available industrial properties in Seeland over time, the gathered statistics of new industrial properties in Seeland over time, the gathered statistics of rented industrial properties in Seeland over time
| Industrial properties | |
|---|---|
| Available premises | 6 |
| New premises since yesterday | 2 |
| Rented out premises since yesterday | 0 |
| Total available m2 | 652 |
| Average price per m2 per year without expenses | 149 |
| Highest price per m2 per year | 182.37 |
| Lowest price per m2 per year | 123.36 |