


Photo provided by Google Street View and may be inaccurate:
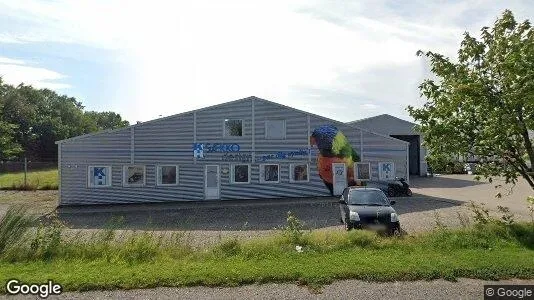

Industrial property for rent, Padborg, Region of Southern Denmark, Thorsvej 11
Thorsvej 11, 6330 Padborg- Industrial property for rent
- Ca. 1,380 m2
- Ca. 50,450 DKK per month
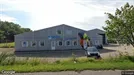
Thorsvej 11, 6330 Padborg
- Industrial property for rent
- Ca. 1,380 m2
- Ca. 50,450 DKK per month
This commercial rental is no longer available.
Search for similar premises on Companyspace.com


