Photo provided by Google Street View and may be inaccurate:
‹
-
Stock photo
-
Stock photo
-
Stock photo
›
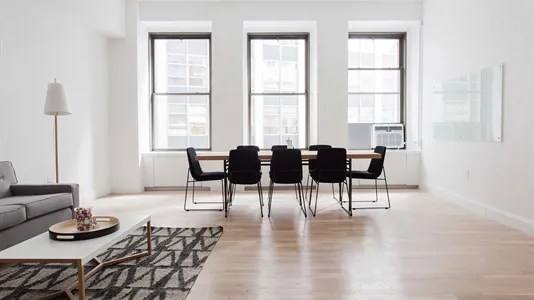
Commercial space for rent, Kolding, Region of Southern Denmark, Pakhustorvet 2
Pakhustorvet 2, 6000 Kolding
- Commercial space for rent
- Ca. 200 m2
- Ca. 15,150 DKK per month
Pakhustorvet 2, 6000 Kolding
- Commercial space for rent
- Ca. 200 m2
- Ca. 15,150 DKK per month
Commercial space for rent, Kolding, Region of Southern Denmark, Pakhustorvet 2
Facts
Report
-
3345256
-
Commercial space
-
Ca. 200 m2
-
Ca. 181,800 DKK
-
Ca. 15,150 DKK
-
Ca. 181,800 DKK
-
Ca. 15,150 DKK
-
Ca. 900 DKK
-
Ca. 900 DKK
-
Erhvervslokaler til leje i 6000 Kolding
Erhvervslokaler til leje i 6000 Kolding
Similar search results
-
363 m2 office space for rent in Kolding, Region of Southern Denmark, Fynsvej
Office space for rent in Kolding, Region of Southern Denmark
Free contact
-
19,506 DKK per month
-
644 DKK /m2/year
-
19 - 57 m2 office space for rent in Kolding, Region of Southern Denmark, Haderslevvej
Office space for rent in Kolding, Region of Southern Denmark
Free contact
-
315 DKK /m2/year
-
280 m2 office space for rent in Kolding, Region of Southern Denmark, Kokholm
Office space for rent in Kolding, Region of Southern Denmark
Free contact
-
900 DKK /m2/year
-
Ca. 695 m2 commercial space for rent in Kolding, Region of Southern Denmark
Commercial space for rent in Kolding, Region of Southern Denmark
-
Ca. 46,450 DKK per month
-
Ca. 800 DKK /m2/year
-
Ca. 3,680 m2 commercial space for rent in Kolding, Region of Southern Denmark
Commercial space for rent in Kolding, Region of Southern Denmark
-
Ca. 138,100 DKK per month
-
Ca. 450 DKK /m2/year
-
Ca. 15 m2 commercial space for rent in Kolding, Region of Southern Denmark
Commercial space for rent in Kolding, Region of Southern Denmark
-
Ca. 2,750 DKK per month
-
Ca. 2,200 DKK /m2/year
-
Commercial space for rent in Kolding, Region of Southern Denmark
Commercial space for rent in Kolding, Region of Southern Denmark
-
Ca. 21,700 DKK per month
-
Ca. 1,295 m2 commercial space for rent in Kolding, Region of Southern Denmark
Commercial space for rent in Kolding, Region of Southern Denmark
-
Ca. 86,200 DKK per month
-
Ca. 800 DKK /m2/year
-
Shop for rent in Kolding, Region of Southern Denmark
Shop for rent in Kolding, Region of Southern Denmark
Free contact