


Commercial space for rent, Bourg-en-Bresse, Auvergne-Rhône-Alpes,
, Bourg-en-Bresse- Commercial space for rent
- 1,544 m2
![Commercial space for rent, Bourg-en-Bresse, Auvergne-Rhône-Alpes, <span class="blurred street" onclick="ProcessAdRequest(2866925)"><span class="hint">See streetname</span>[xxxxxxxxxxxxx]</span>](/StaticFiles/media/313122/Cache/chairs-2181947_1920_134.webp)
Commercial space for rent, Bourg-en-Bresse, Auvergne-Rhône-Alpes,
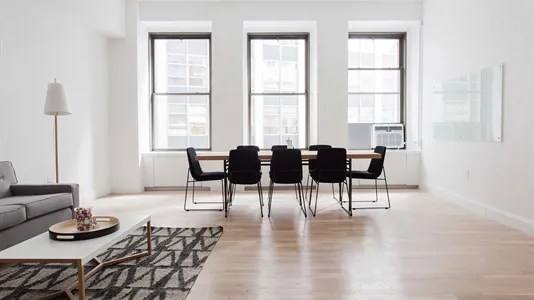
Commercial space for rent in Bourg-en-Bresse, Auvergne-Rhône-Alpes
Information and data
This company space that can be used as Commercial space, is located in Bourg-en-Bresse. Bourg-en-Bresse is located in in Auvergne-Rhône-Alpes. The company space is 1544 m2 in total.
Similar search results
-
176 m2 commercial space for rent in Bourg-en-Bresse, Auvergne-Rhône-Alpes
- 1,907 EUR per month
- 130 EUR /m2/year
-
3000 m2 commercial space for rent in Bourg-en-Bresse, Auvergne-Rhône-Alpes
- 21,250 EUR per month
- 85 EUR /m2/year
-
450 m2 commercial space for rent in Bourg-en-Bresse, Auvergne-Rhône-Alpes
- 3,187 EUR per month
- 84.99 EUR /m2/year
-
300 m2 commercial space for rent in Bourg-en-Bresse, Auvergne-Rhône-Alpes
- 3,700 EUR per month
- 148 EUR /m2/year
-
248 m2 office space for rent in Bourg-en-Bresse, Auvergne-Rhône-Alpes
- 3,310 EUR per month
- 160 EUR /m2/year
-
354 m2 warehouse for rent in Bourg-en-Bresse, Auvergne-Rhône-Alpes
- 1,400 EUR per month
- 47 EUR /m2/year
-
89 m2 office space for rent in Bourg-en-Bresse, Auvergne-Rhône-Alpes
- 1,125 EUR per month
- 151.69 EUR /m2/year
-
286 m2 warehouse for rent in Bourg-en-Bresse, Auvergne-Rhône-Alpes
- 1,950 EUR per month
- 82 EUR /m2/year


Frequently asked questions
Statistics on the development of available commercial properties for rent in Bourg-en-Bresse over the past month
Below you can see the development of available commercial properties for rent in Bourg-en-Bresse over the past month. In the first column you see the date. In the second column you see the total amount of commercial properties for rent in Bourg-en-Bresse on the date. In the third column you see the amount of new commercial properties in Bourg-en-Bresse that was available for rent on the date. In the fourth column you see the amount of commercial properties in Bourg-en-Bresse that was rented on the date. Also see aggregate statistics on all available commercial properties in Bourg-en-Bresse over time, aggregate statistics on new commercial properties in Bourg-en-Bresse over time, aggregate statistics on rented commercial properties in Bourg-en-Bresse over time
| Date | All commercial properties for rent | New commercial properties for rent | Rented out commercial properties |
|---|---|---|---|
| 24. October 2025 | 59 | 3 | 3 |
| 23. October 2025 | 59 | 5 | 0 |
| 22. October 2025 | 54 | 0 | 2 |
| 21. October 2025 | 56 | 10 | 8 |
| 20. October 2025 | 54 | 1 | 1 |
| 19. October 2025 | 54 | 0 | 0 |
| 18. October 2025 | 54 | 0 | 1 |
| 17. October 2025 | 55 | 0 | 0 |
| 16. October 2025 | 55 | 1 | 1 |
| 15. October 2025 | 55 | 1 | 2 |
| 14. October 2025 | 56 | 2 | 0 |
| 13. October 2025 | 54 | 7 | 12 |
| 12. October 2025 | 59 | 0 | 0 |
| 11. October 2025 | 59 | 4 | 5 |
| 10. October 2025 | 60 | 10 | 0 |
| 9. October 2025 | 50 | 3 | 3 |
| 8. October 2025 | 50 | 4 | 5 |
| 7. October 2025 | 51 | 0 | 5 |
| 6. October 2025 | 56 | 0 | 2 |
| 5. October 2025 | 58 | 3 | 6 |
| 4. October 2025 | 61 | 4 | 0 |
| 3. October 2025 | 57 | 1 | 2 |
| 2. October 2025 | 58 | 0 | 3 |
| 1. October 2025 | 61 | 1 | 1 |
| 30. September 2025 | 61 | 1 | 0 |
| 29. September 2025 | 60 | 0 | 0 |
| 28. September 2025 | 60 | 0 | 1 |
| 27. September 2025 | 61 | 9 | 7 |
| 26. September 2025 | 59 | 0 | 5 |
| 25. September 2025 | 64 | 0 | 0 |
| 24. September 2025 | 64 | 0 | 0 |
Statistics on currently available commercial properties for rent in Bourg-en-Bresse
In the table below, you see a series of data about available commercial properties to rent in Bourg-en-Bresse.Also see gathered statistics of all available commercial properties in Bourg-en-Bresse over time, the gathered statistics of new commercial properties in Bourg-en-Bresse over time, the gathered statistics of rented commercial properties in Bourg-en-Bresse over time
| Commercial properties | |
|---|---|
| Available premises | 57 |
| New premises since yesterday | 3 |
| Rented out premises since yesterday | 3 |
| Total available m2 | 222,473 |
| Average price per m2 per year without expenses | 16,101 |
| Highest price per m2 per year | 765,000 |
| Lowest price per m2 per year | 37.71 |