


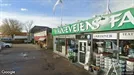
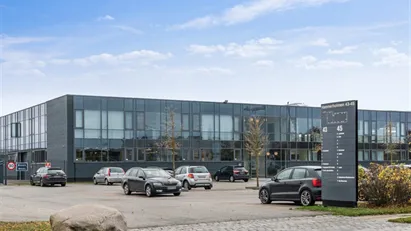
Photo provided by Google Street View and may be inaccurate:


Clinic for rent, Hvidovre, Greater Copenhagen, Gl. Koege Landevej 272
- 22 - 25 m2
- Ca. 5,000 DKK per month
GET MORE INFO NOW
⚡See all details about the premise and get direct access to the landlord's contact information.
Clinic for rent, Hvidovre, Greater Copenhagen, Gl. Koege Landevej 272

22 - 25m2

Ca. 5,850 DKK

Clinic

Hvidovre, Greater Copenhagen
Facts
Report- 3467293
- Clinic
- Office space
- Coworking space
- 1 - 2
- 22 - 25 m2
- Ca. 70,000 DKK
- Ca. 5,850 DKK
- Ca. 2,400 DKK
- Ca. 2,800 DKK
Similar search results
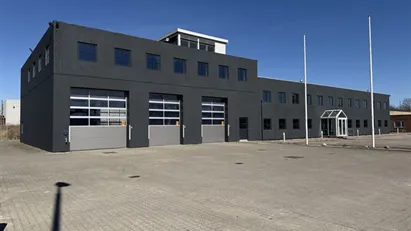
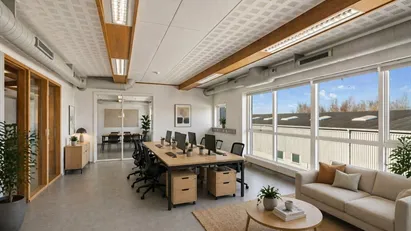
Office space in Hvidovre, Greater Copenhagen
 More info
Office space in Hvidovre, Greater Copenhagen
Office space for rent in Hvidovre, Greater Copenhagen
Areal
1,885 m2
Pris pr. md.
133,521 DKK per month
Område
Hvidovre, Greater Copenhagen
Type
Office space
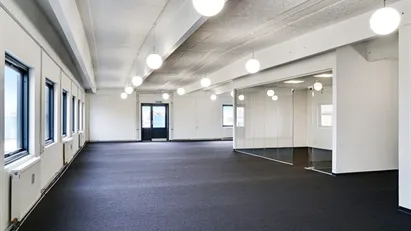
Office space in Hvidovre, Greater Copenhagen
 More info
Office space in Hvidovre, Greater Copenhagen
Office space for rent in Hvidovre, Greater Copenhagen
Areal
222 m2
Pris pr. md.
12,950 DKK per month
Område
Hvidovre, Greater Copenhagen
Type
Office space
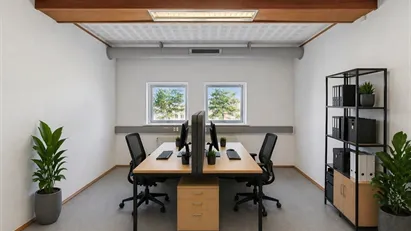
Office space in Hvidovre, Greater Copenhagen
 More info
Office space in Hvidovre, Greater Copenhagen
Office space for rent in Hvidovre, Greater Copenhagen
Areal
55 m2
Pris pr. md.
5,610 DKK per month
Område
Hvidovre, Greater Copenhagen
Type
Office space
Office space in Hvidovre, Greater Copenhagen
 More info
Office space in Hvidovre, Greater Copenhagen
Office space for rent in Hvidovre, Greater Copenhagen
Areal
130 m2
Pris pr. md.
13,260 DKK per month
Område
Hvidovre, Greater Copenhagen
Type
Office space
Office space in Hvidovre, Greater Copenhagen
 More info
Office space in Hvidovre, Greater Copenhagen
Office space for rent in Hvidovre, Greater Copenhagen
Areal
185 m2
Pris pr. md.
18,870 DKK per month
Område
Hvidovre, Greater Copenhagen
Type
Office space
Showroom in Hvidovre, Greater Copenhagen
 More info
Showroom in Hvidovre, Greater Copenhagen
Showroom for rent in Hvidovre, Greater Copenhagen
Areal
1,885 m2
Pris pr. md.
133,521 DKK per month
Område
Hvidovre, Greater Copenhagen
Type
Showroom
Showroom in Hvidovre, Greater Copenhagen
 More info
Showroom in Hvidovre, Greater Copenhagen
Showroom for rent in Hvidovre, Greater Copenhagen
Areal
505 m2
Pris pr. md.
35,770 DKK per month
Område
Hvidovre, Greater Copenhagen
Type
Showroom
Warehouse in Hvidovre, Greater Copenhagen
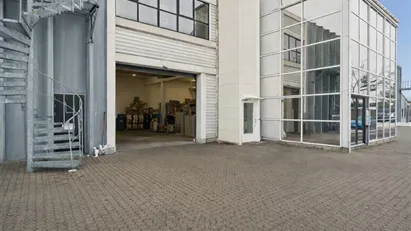 More info
Warehouse in Hvidovre, Greater Copenhagen
Warehouse for rent in Hvidovre, Greater Copenhagen
Areal
212 m2
Pris pr. md.
15,017 DKK per month
Område
Hvidovre, Greater Copenhagen
Type
Warehouse
Warehouse in Hvidovre, Greater Copenhagen
 More info
Warehouse in Hvidovre, Greater Copenhagen
Warehouse for rent in Hvidovre, Greater Copenhagen
Areal
965 m2
Pris pr. md.
100,521 DKK per month
Område
Hvidovre, Greater Copenhagen
Type
Warehouse
Selected customers
Selected customers
30,000 customers use Companyspace.com
30,000 customers
285,000 companies in our database
2,400 rentals annually
Companyspace.com is used by thousands of landlords, property companies, commercial real estate agents, investors and business centres seeking greater visibility, more enquiries and lower vacancy rates.


