


Commercial premises in Sønderborg
Companyspace.com today:
New today 1,071
Updated 24h 1,312
Notifications about new companyspaces1,914
Stockholm +4
Amsterdam +1
Berlin +7
Oslo +2
Brussels +13
Vienna +31
Paris +5
Dublin (county) +36
Warsaw +36
Latest update 2 h ago
Active ads 360,629
149 company spaces found
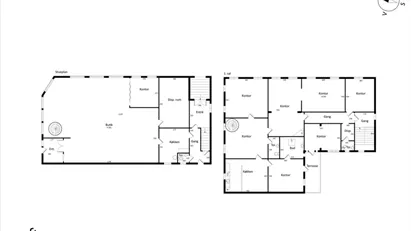
Shop in Sønderborg, Region of Southern Denmark
More info
We monitor the market!
Shop in Sønderborg, Region of Southern Denmark
Shop for rent in Sønderborg, Region of Southern Denmark
Areal
Ca. 850 m2
Pris pr. md.
Ca. 38,950 DKK pr md
Område
Sønderborg, Region of Southern Denmark
Type
Shop
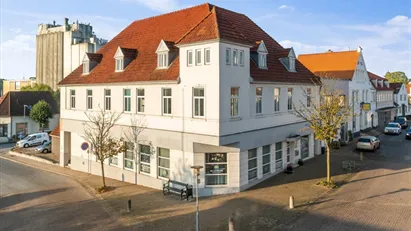
Shop in Sønderborg, Region of Southern Denmark
More info
We monitor the market!
Shop in Sønderborg, Region of Southern Denmark
Shop for rent in Sønderborg, Region of Southern Denmark
Areal
Ca. 360 m2
Pris pr. md.
Ca. 22,550 DKK pr md
Område
Sønderborg, Region of Southern Denmark
Type
Shop
Office space in Sønderborg, Region of Southern Denmark
 More info
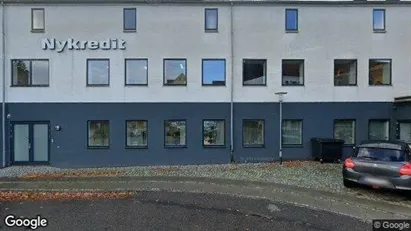
Office space in Sønderborg, Region of Southern Denmark
Office space for rent in Sønderborg, Region of Southern Denmark
Areal
Ca. 560 m2
Pris pr. md.
Not stated
Område
Sønderborg, Region of Southern Denmark
Type
Office space
Office space in Sønderborg, Region of Southern Denmark
 More info
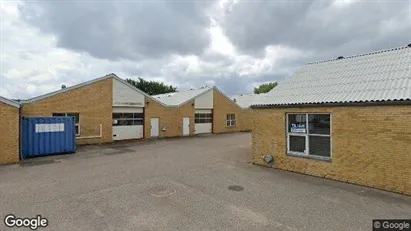
Office space in Sønderborg, Region of Southern Denmark
Office space for rent in Sønderborg, Region of Southern Denmark
Areal
Ca. 560 m2
Pris pr. md.
Not stated
Område
Sønderborg, Region of Southern Denmark
Type
Office space
Office property in Sønderborg, Region of Southern Denmark
 More info
Office property in Sønderborg, Region of Southern Denmark
Office space for sale in Sønderborg, Region of Southern Denmark
Areal
Ca. 865 m2
Pris
Not stated
Område
Sønderborg, Region of Southern Denmark
Type
Office space
Commercial property in Sønderborg, Region of Southern Denmark
 More info
Commercial property in Sønderborg, Region of Southern Denmark
Commercial property for sale in Sønderborg, Region of Southern Denmark
Areal
Ca. 325 m2
Pris
Not stated
Område
Sønderborg, Region of Southern Denmark
Type
Commercial property
Commercial property in Sønderborg, Region of Southern Denmark
 More info
Commercial property in Sønderborg, Region of Southern Denmark
Commercial property for sale in Sønderborg, Region of Southern Denmark
Areal
Ca. 800 m2
Pris
Not stated
Område
Sønderborg, Region of Southern Denmark
Type
Commercial property
Office space in Sønderborg, Region of Southern Denmark
More info
We monitor the market!
Office space in Sønderborg, Region of Southern Denmark
Office space for rent in Sønderborg, Region of Southern Denmark
Areal
Ca. 560 m2
Pris pr. md.
Not stated
Område
Sønderborg, Region of Southern Denmark
Type
Office space
Office property in Sønderborg, Region of Southern Denmark
 More info
Office property in Sønderborg, Region of Southern Denmark
Office space for sale in Sønderborg, Region of Southern Denmark
Areal
Ca. 655 m2
Pris
Not stated
Område
Sønderborg, Region of Southern Denmark
Type
Office space
Office property in Sønderborg, Region of Southern Denmark
 More info
Office property in Sønderborg, Region of Southern Denmark
Office space for sale in Sønderborg, Region of Southern Denmark
Areal
Ca. 145 m2
Pris
Not stated
Område
Sønderborg, Region of Southern Denmark
Type
Office space
Commercial property in Sønderborg, Region of Southern Denmark
 More info
Commercial property in Sønderborg, Region of Southern Denmark
Commercial property for sale in Sønderborg, Region of Southern Denmark
Areal
Ca. 945 m2
Pris
Not stated
Område
Sønderborg, Region of Southern Denmark
Type
Commercial property
Warehouse property in Sønderborg, Region of Southern Denmark
 More info
Warehouse property in Sønderborg, Region of Southern Denmark
Warehouse for sale in Sønderborg, Region of Southern Denmark
Areal
Ca. 3,635 m2
Pris
Not stated
Område
Sønderborg, Region of Southern Denmark
Type
Warehouse
Commercial property in Sønderborg, Region of Southern Denmark
 More info
Commercial property in Sønderborg, Region of Southern Denmark
Commercial property for sale in Sønderborg, Region of Southern Denmark
Areal
Ca. 220 m2
Pris
Not stated
Område
Sønderborg, Region of Southern Denmark
Type
Commercial property
Commercial property in Sønderborg, Region of Southern Denmark
More info
Commercial property in Sønderborg, Region of Southern Denmark
Commercial property for sale in Sønderborg, Region of Southern Denmark
Areal
Ca. 515 m2
Pris
Not stated
Område
Sønderborg, Region of Southern Denmark
Type
Commercial property
Industrial property in Sønderborg, Region of Southern Denmark
More info
Industrial property in Sønderborg, Region of Southern Denmark
Industrial property for sale in Sønderborg, Region of Southern Denmark
Areal
Ca. 275 m2
Pris
Not stated
Område
Sønderborg, Region of Southern Denmark
Type
Industrial property
Commercial property in Sønderborg, Region of Southern Denmark
More info
Commercial property in Sønderborg, Region of Southern Denmark
Commercial property for sale in Sønderborg, Region of Southern Denmark
Areal
Ca. 395 m2
Pris
Not stated
Område
Sønderborg, Region of Southern Denmark
Type
Commercial property
Industrial property in Sønderborg, Region of Southern Denmark
More info
Industrial property in Sønderborg, Region of Southern Denmark
Industrial property for sale in Sønderborg, Region of Southern Denmark
Areal
Ca. 1,800 m2
Pris
Not stated
Område
Sønderborg, Region of Southern Denmark
Type
Industrial property
Commercial property in Sønderborg, Region of Southern Denmark
More info
Commercial property in Sønderborg, Region of Southern Denmark
Commercial property for sale in Sønderborg, Region of Southern Denmark
Areal
Ca. 255 m2
Pris
Not stated
Område
Sønderborg, Region of Southern Denmark
Type
Commercial property
Selected customers
30,000 customers use Companyspace.com
30,000 customers
285,000 companies in our database
2,400 rentals annually
Companyspace.com is used by thousands of landlords, property companies, commercial real estate agents, investors and business centres seeking greater visibility, more enquiries and lower vacancy rates.


